Fair Lending: Redline Mapping
Visualizing HMDA data to investigate instances of lending discrimination
The CFPB is developing a comprehensive mapping tool that allows examiners to assess discriminatory patterns in institutional lending policies that lead to disparate impact, a practice historically known as redlining.
The concept of redlining stems from a practice of banks drawing "red lines" around specific urban neighborhoods, effectively outlining where they were unwilling to provide mortgages to residents. The Fair Housing Act, enacted in 1968, outlawed the refusal to sell or rent a dwelling to any group based on race, national origin, color, religion, sex, familial status, or disability when there is no legitimate, non-discriminatory business need for the policy.
The Home Mortgage Disclosure Act (HMDA) now requires financial institutions to maintain, report, and publicly disclose information about mortgages. By mapping this data, Bureau employees can investigate potential redlining violations by comparing institutional lending patterns to a city's socio-economic distribution.
Visualization Research
Exploring representational approaches that improve the legibility of redline maps.
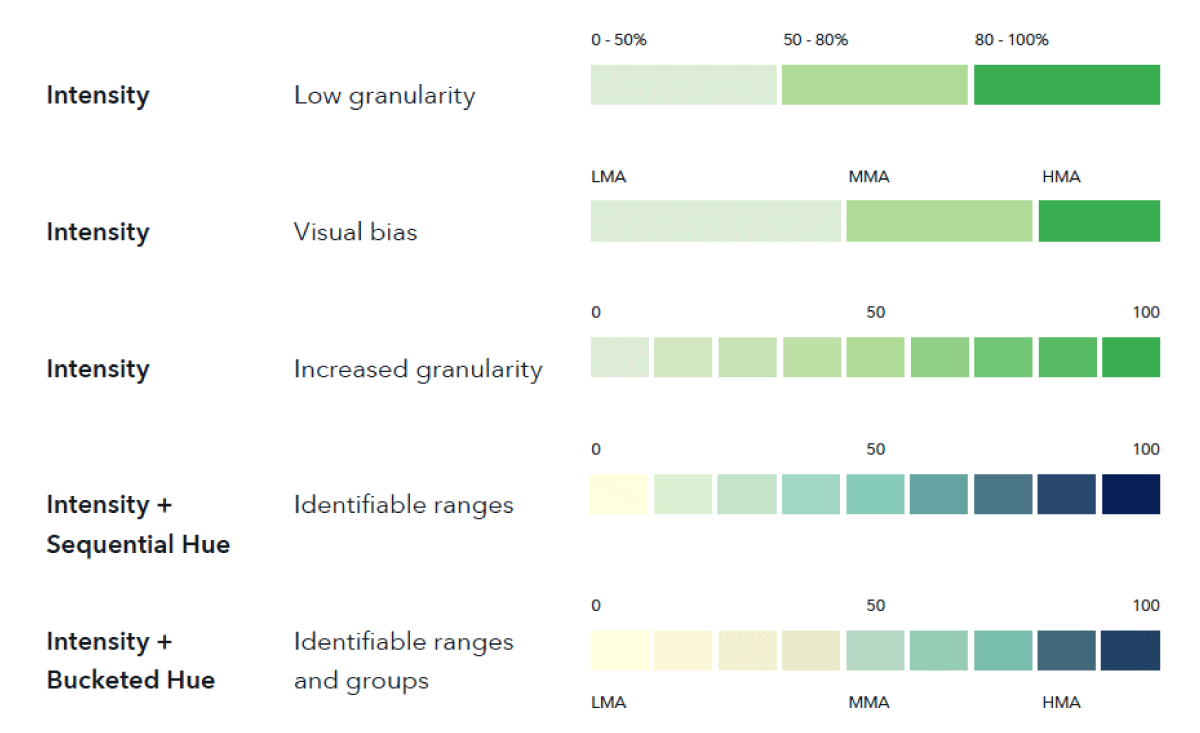
Complex color ramps
Diagrams exploring the potential of combining increasing intensity and multiple hues to show high/medium/low minority area buckets
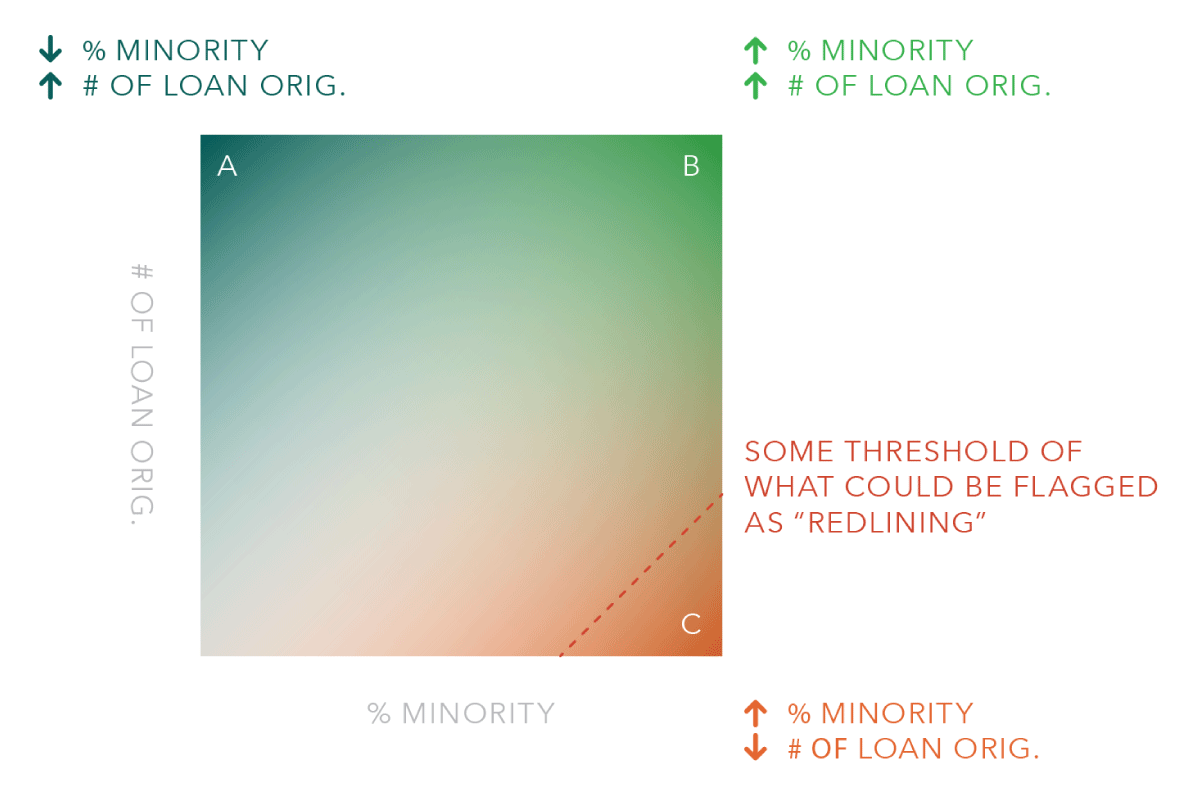
Multivariate color ramps
Diagram to illustrate the use of a multi-directional color ramp that combines the conditions of minority percentage and loan counts
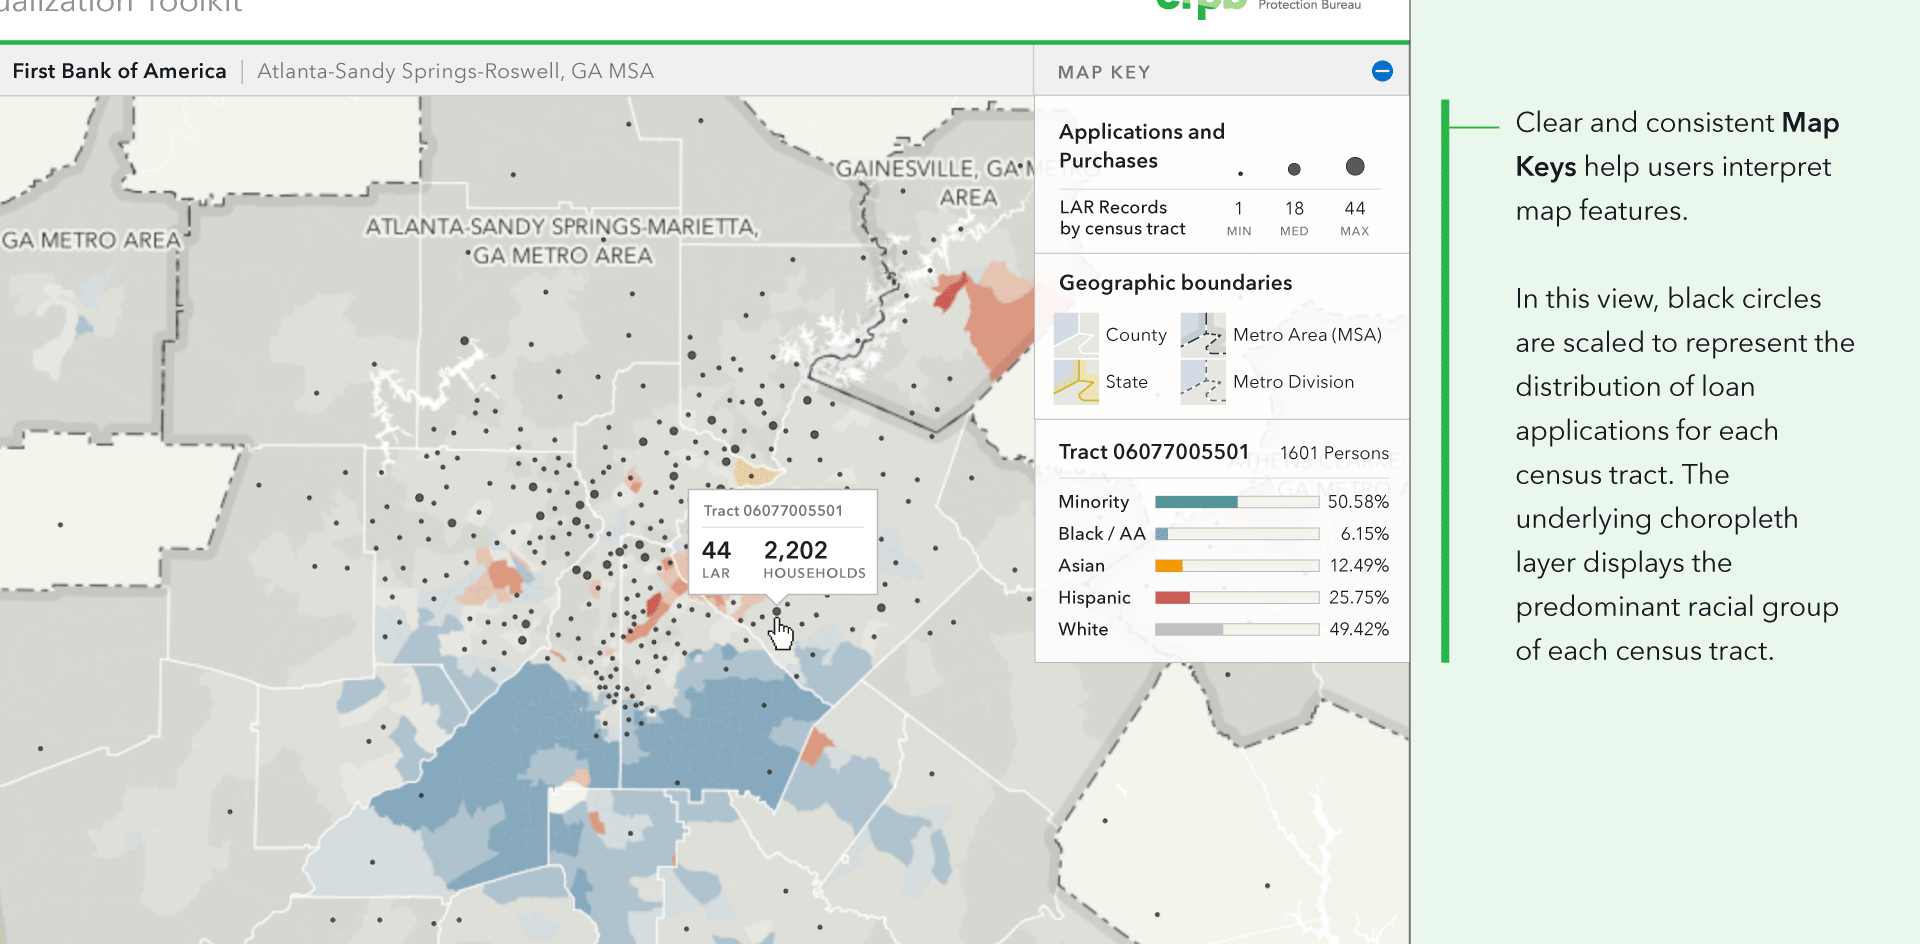
Dot Density vs. Scaled Circles
Diagram to compare aggregated circles to dots for representing loan records
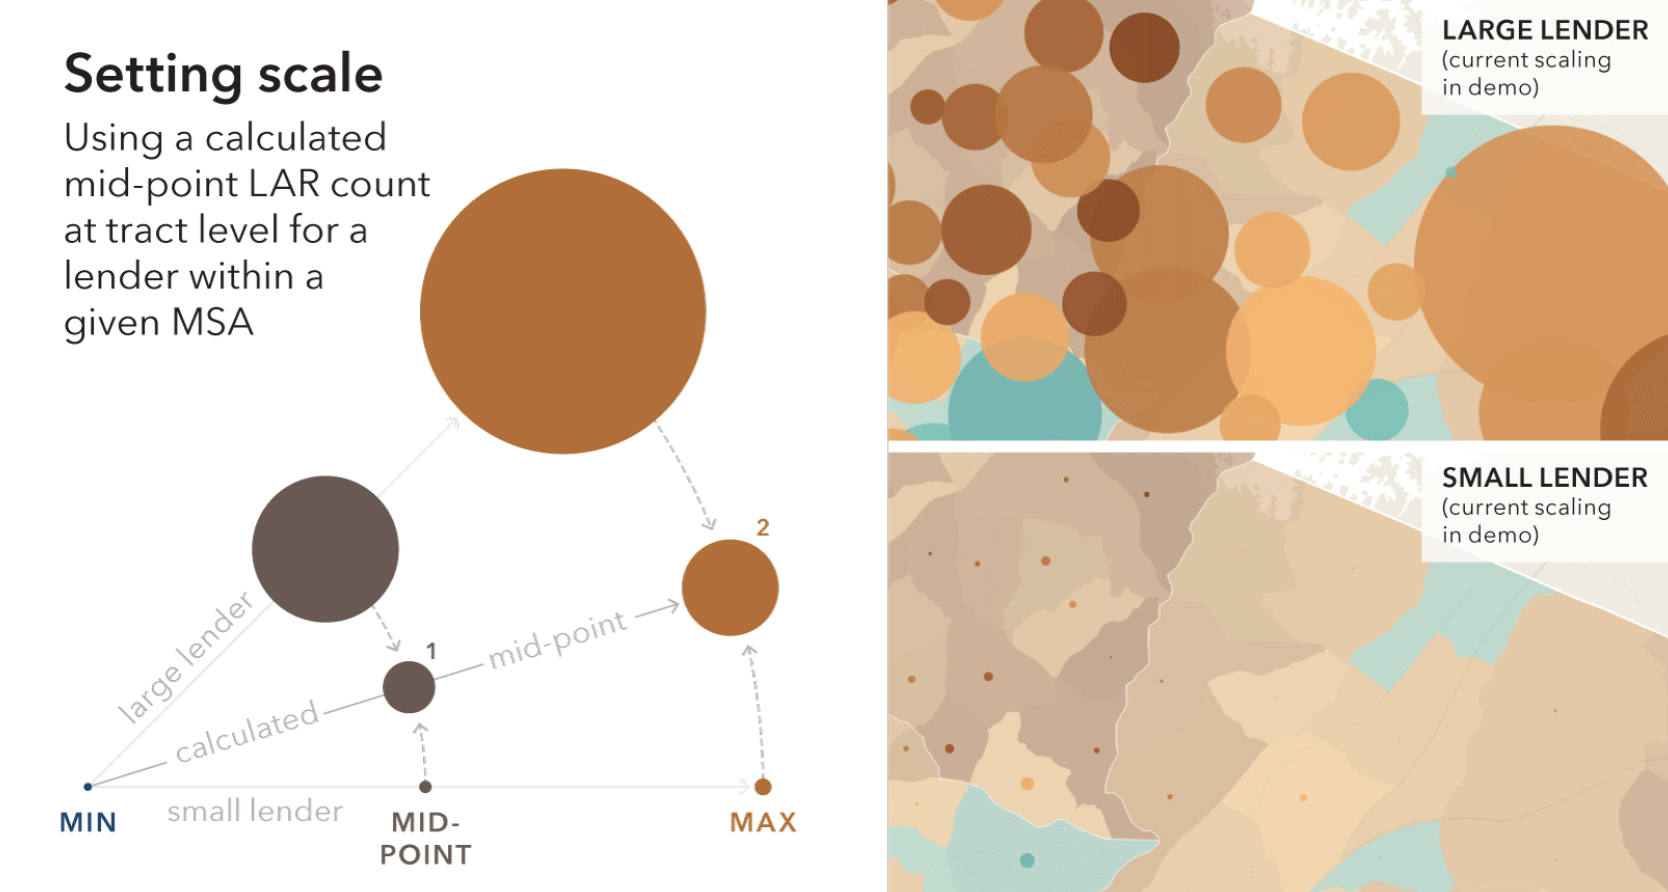
Legible circle scaling
Diagram to illustrate the conceptual impact of setting the mid-point circle size within a given MSA by calculating the median value LAR count at tract level
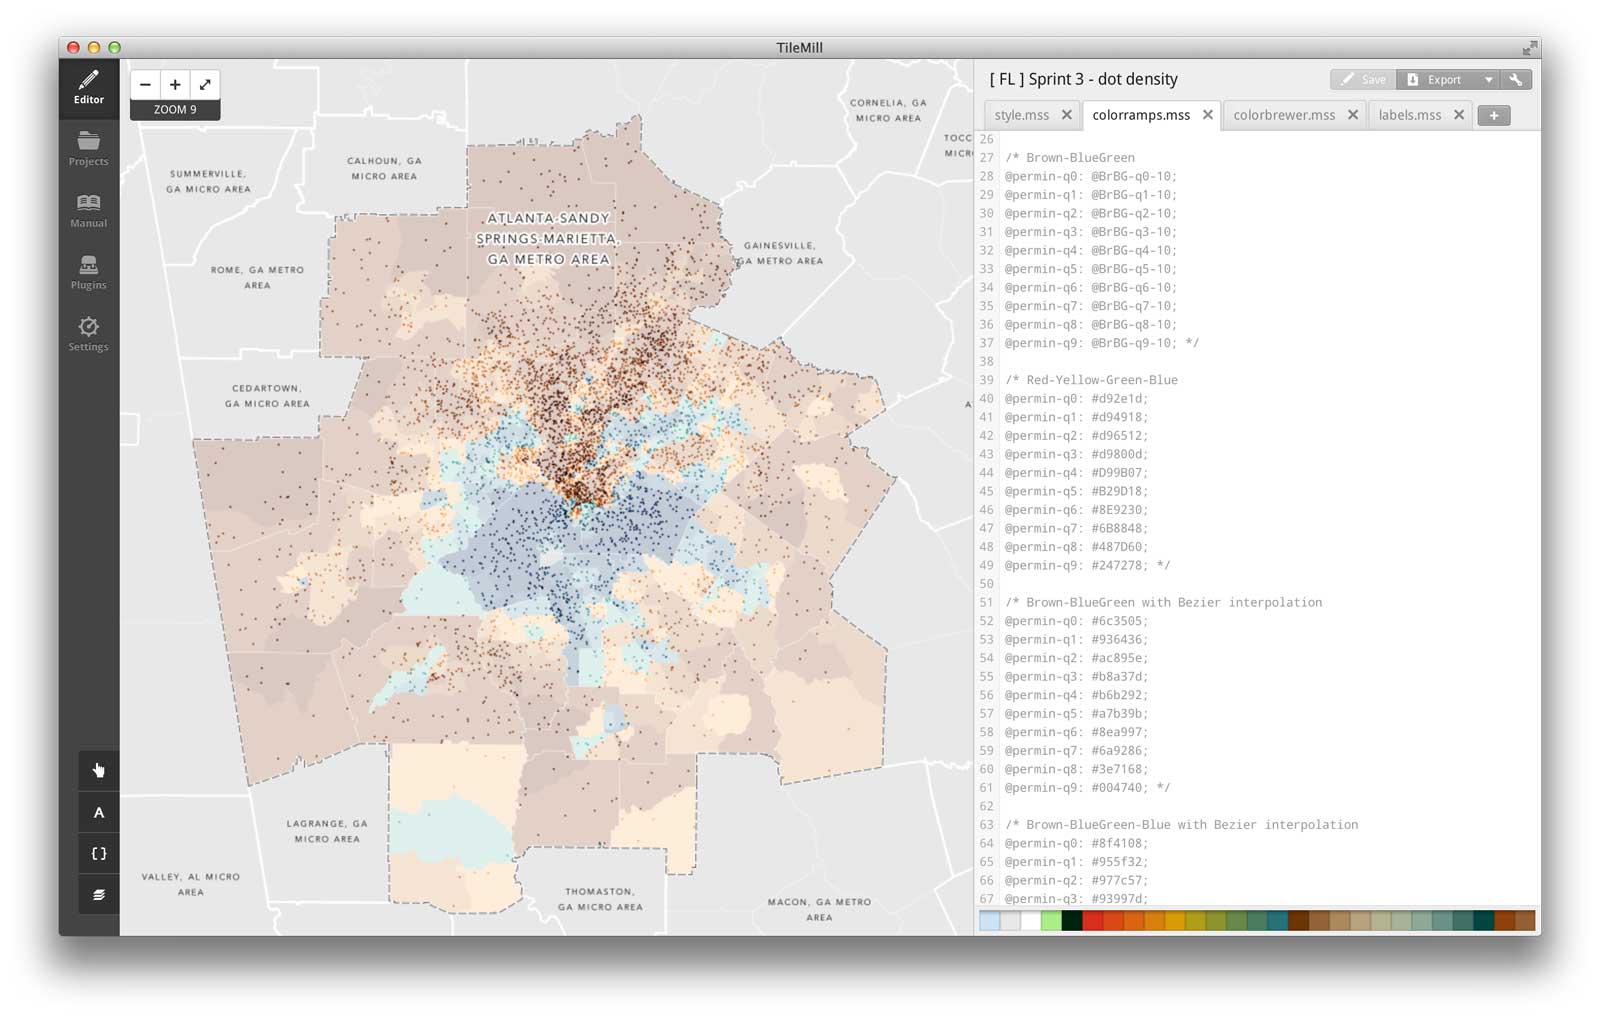
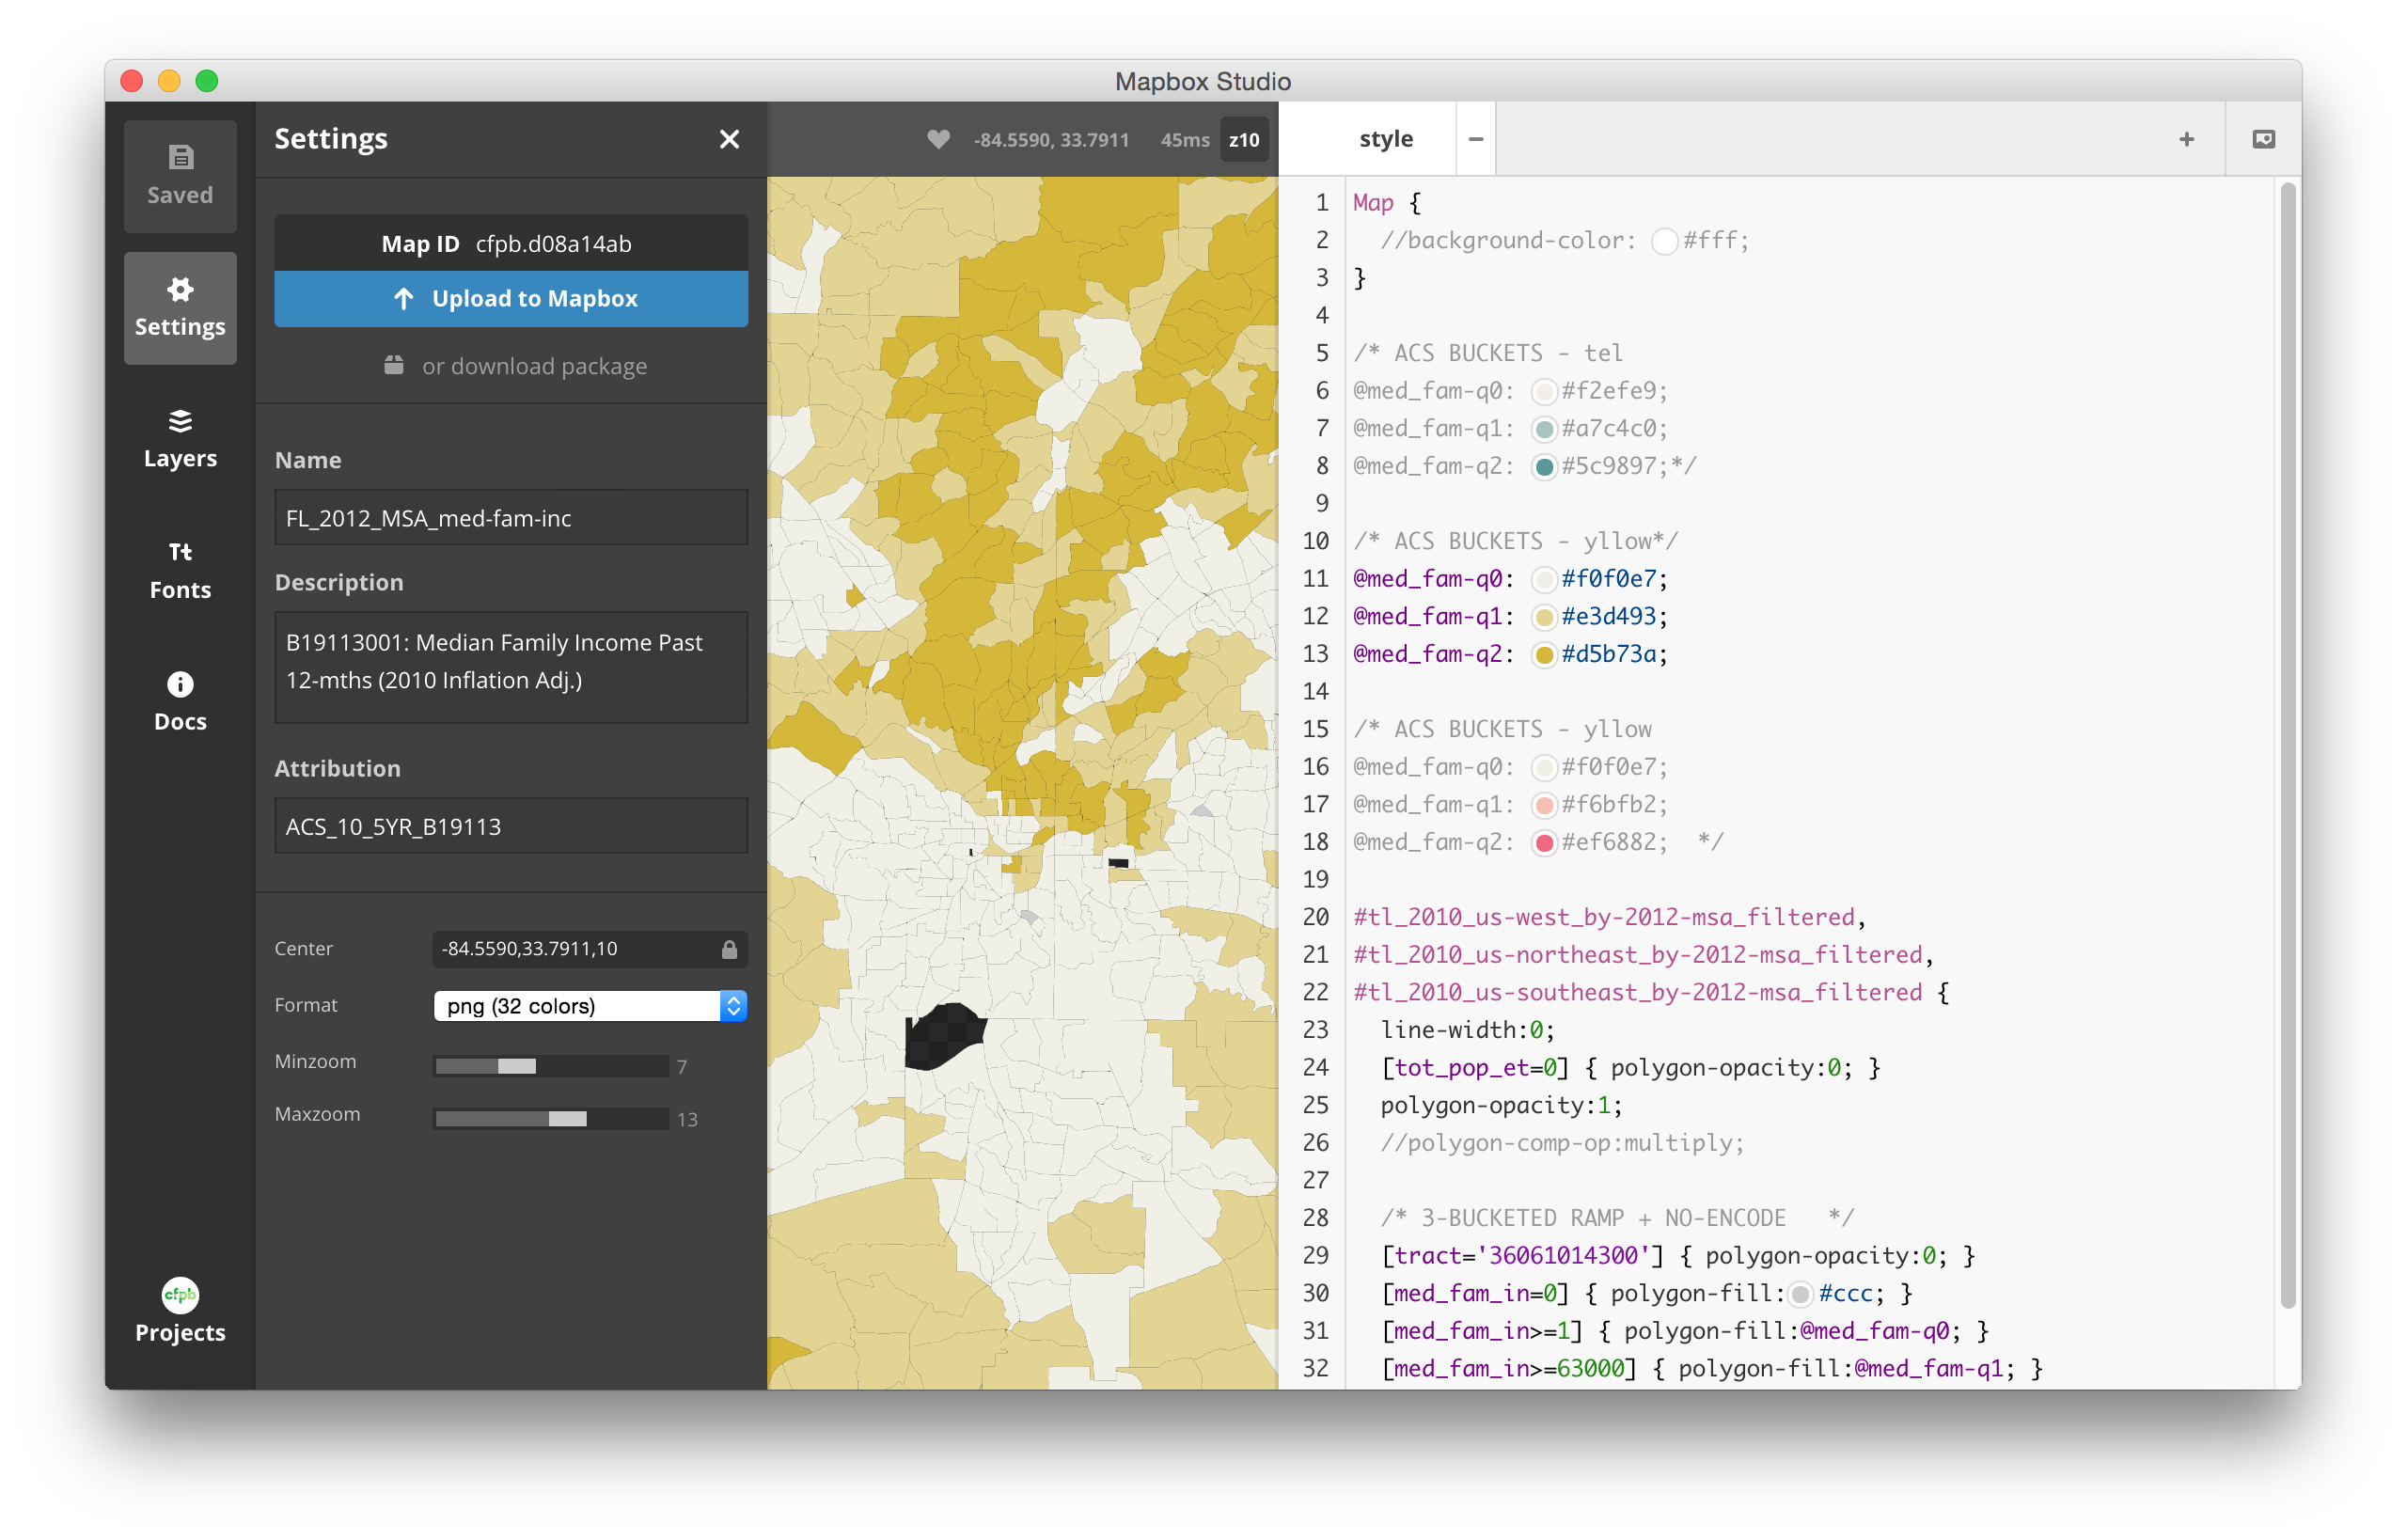
Map design
Key cartography decisions were demonstrated using tools like Tilemill, Mapbox Studio, & QGIS.
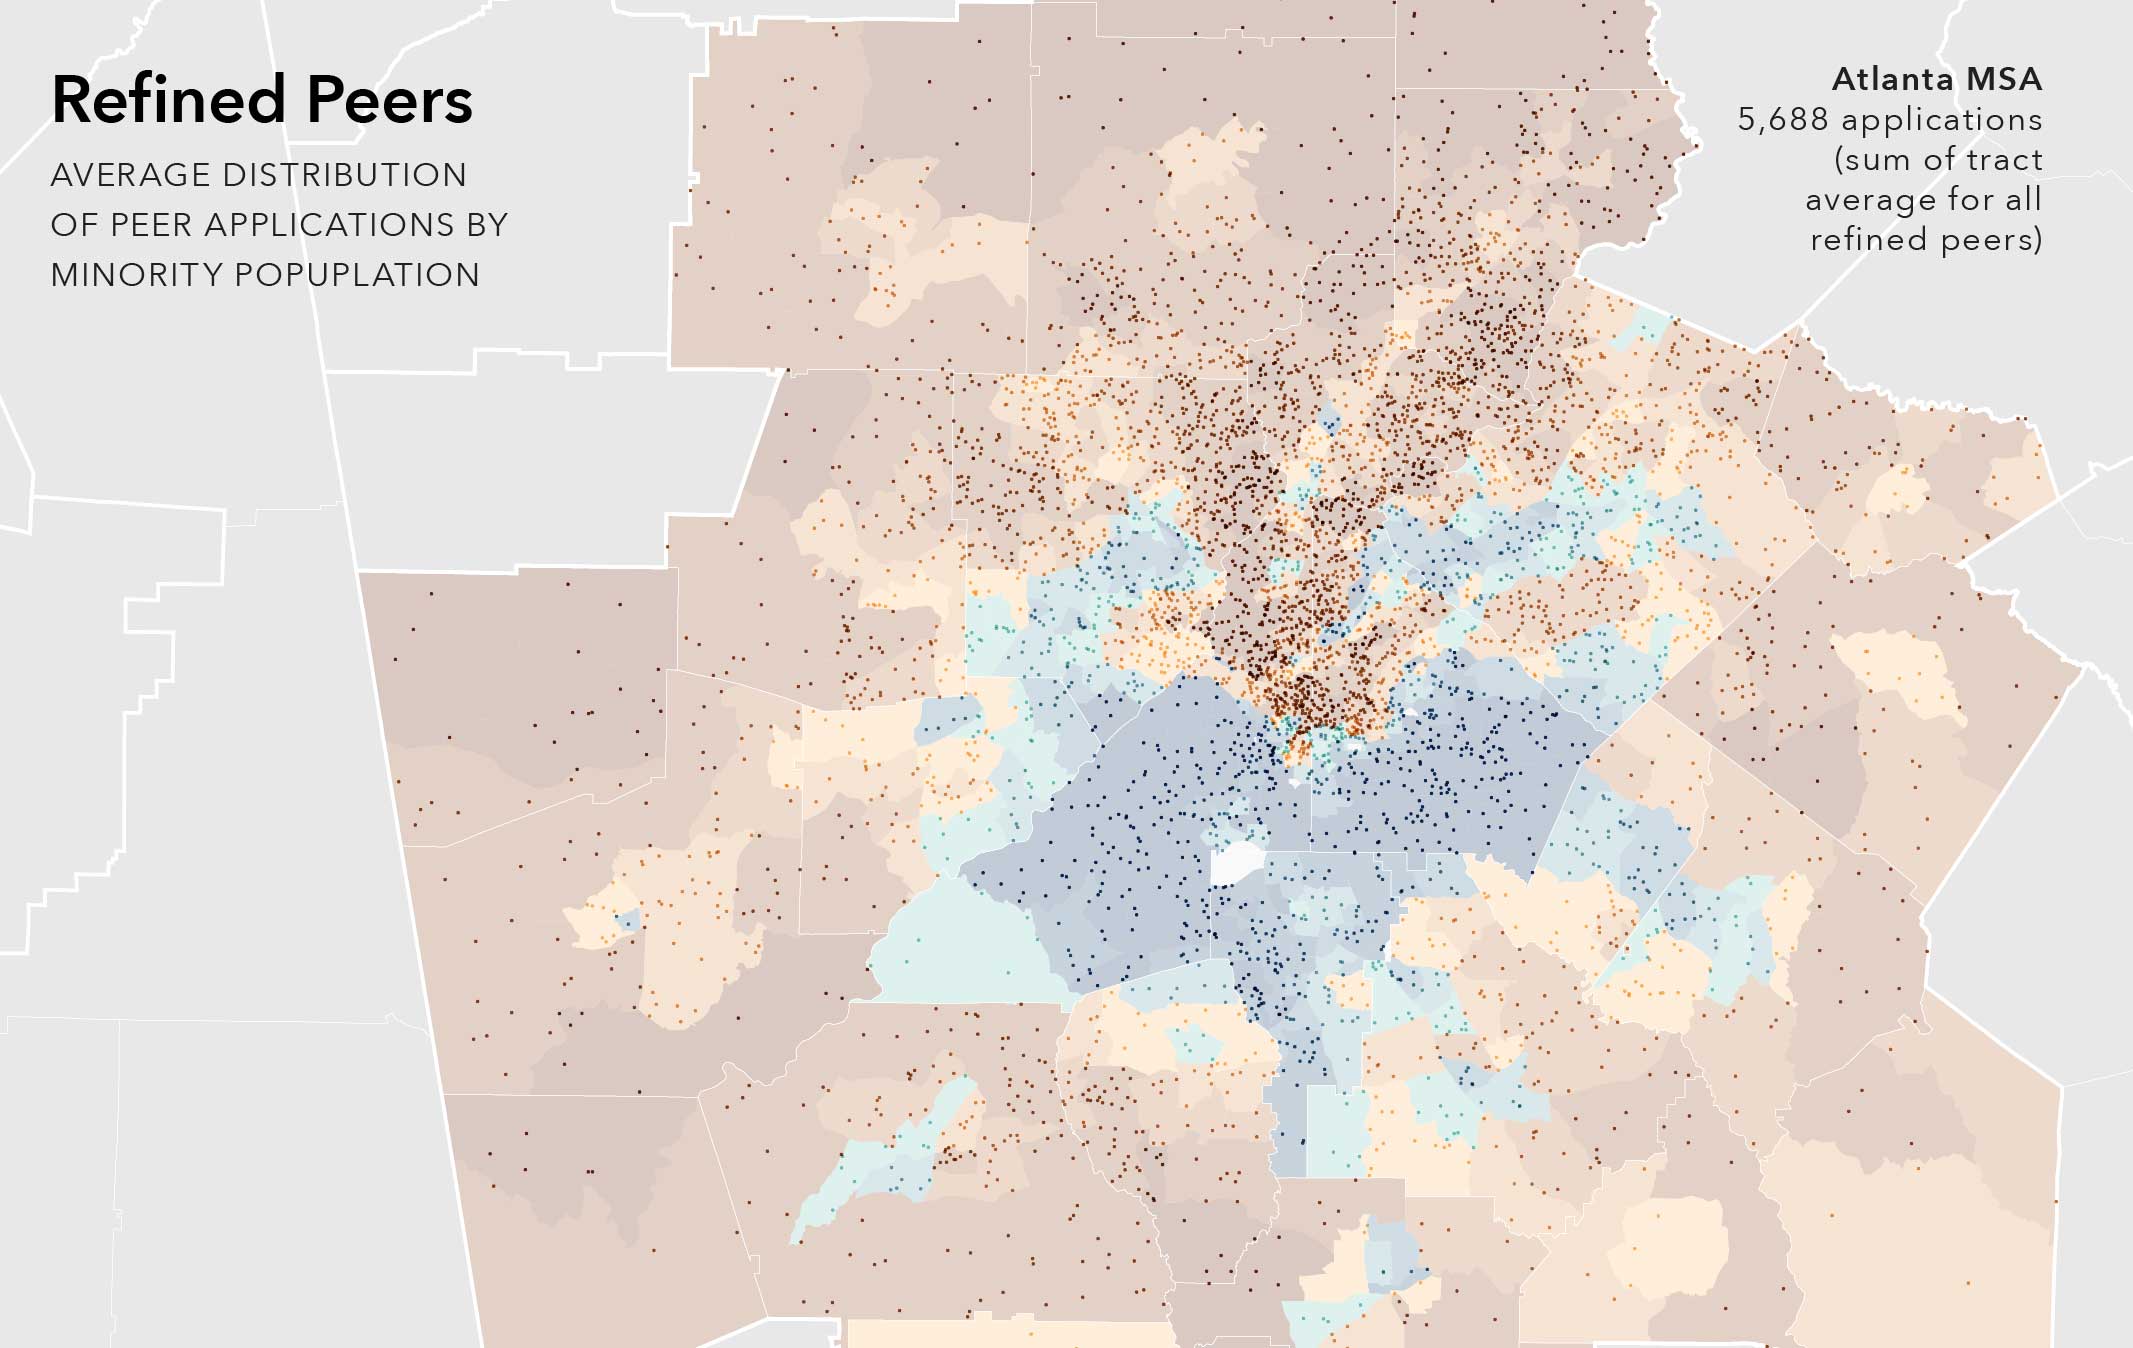
Comparative Mapping
Statistical methods allow users to compare the actions of a lender to similar peer lenders in a given market.
This allows them to assess if a lender's actions resemble the general patterns shown.
Hypothesis Testing
Helped inform key cartographic decisions
Variations on map design are shared with the Bureau's examiners to determine effective approaches for identifying potential redlining violations.
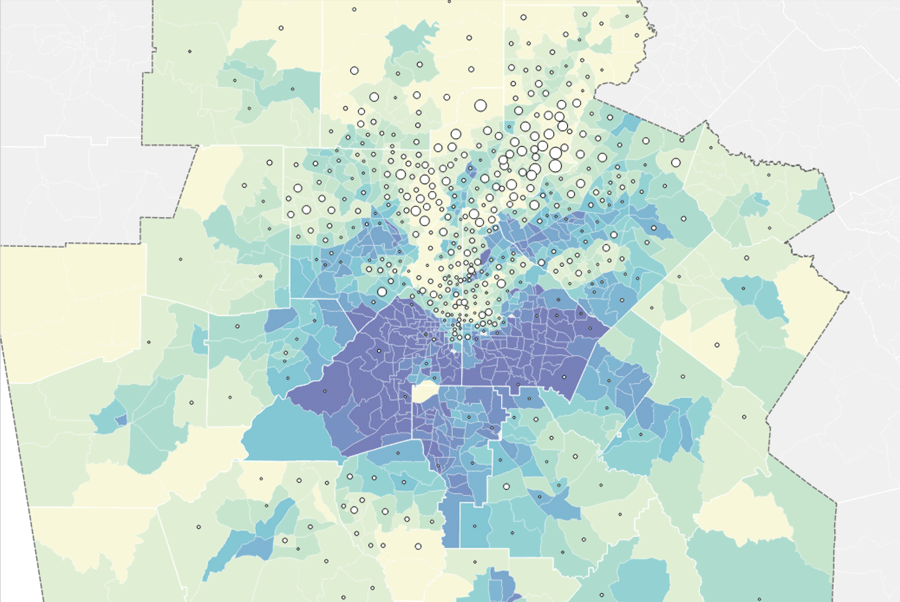
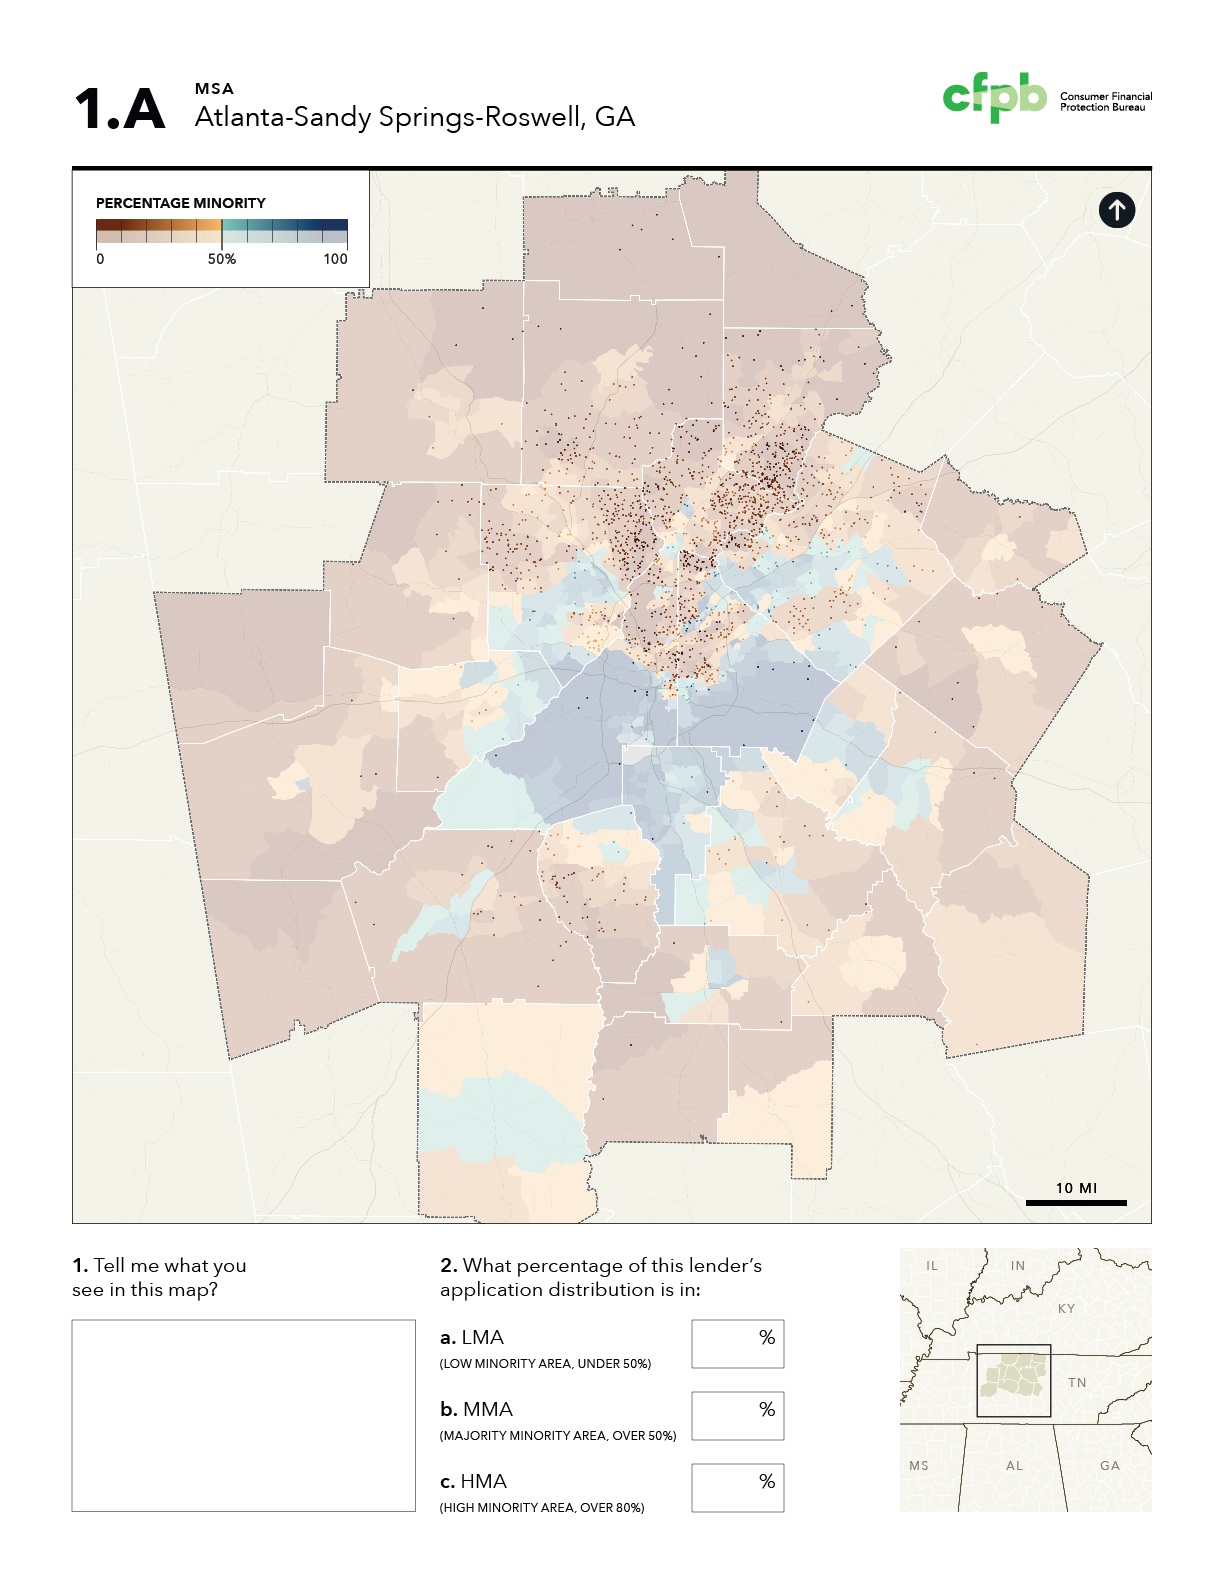
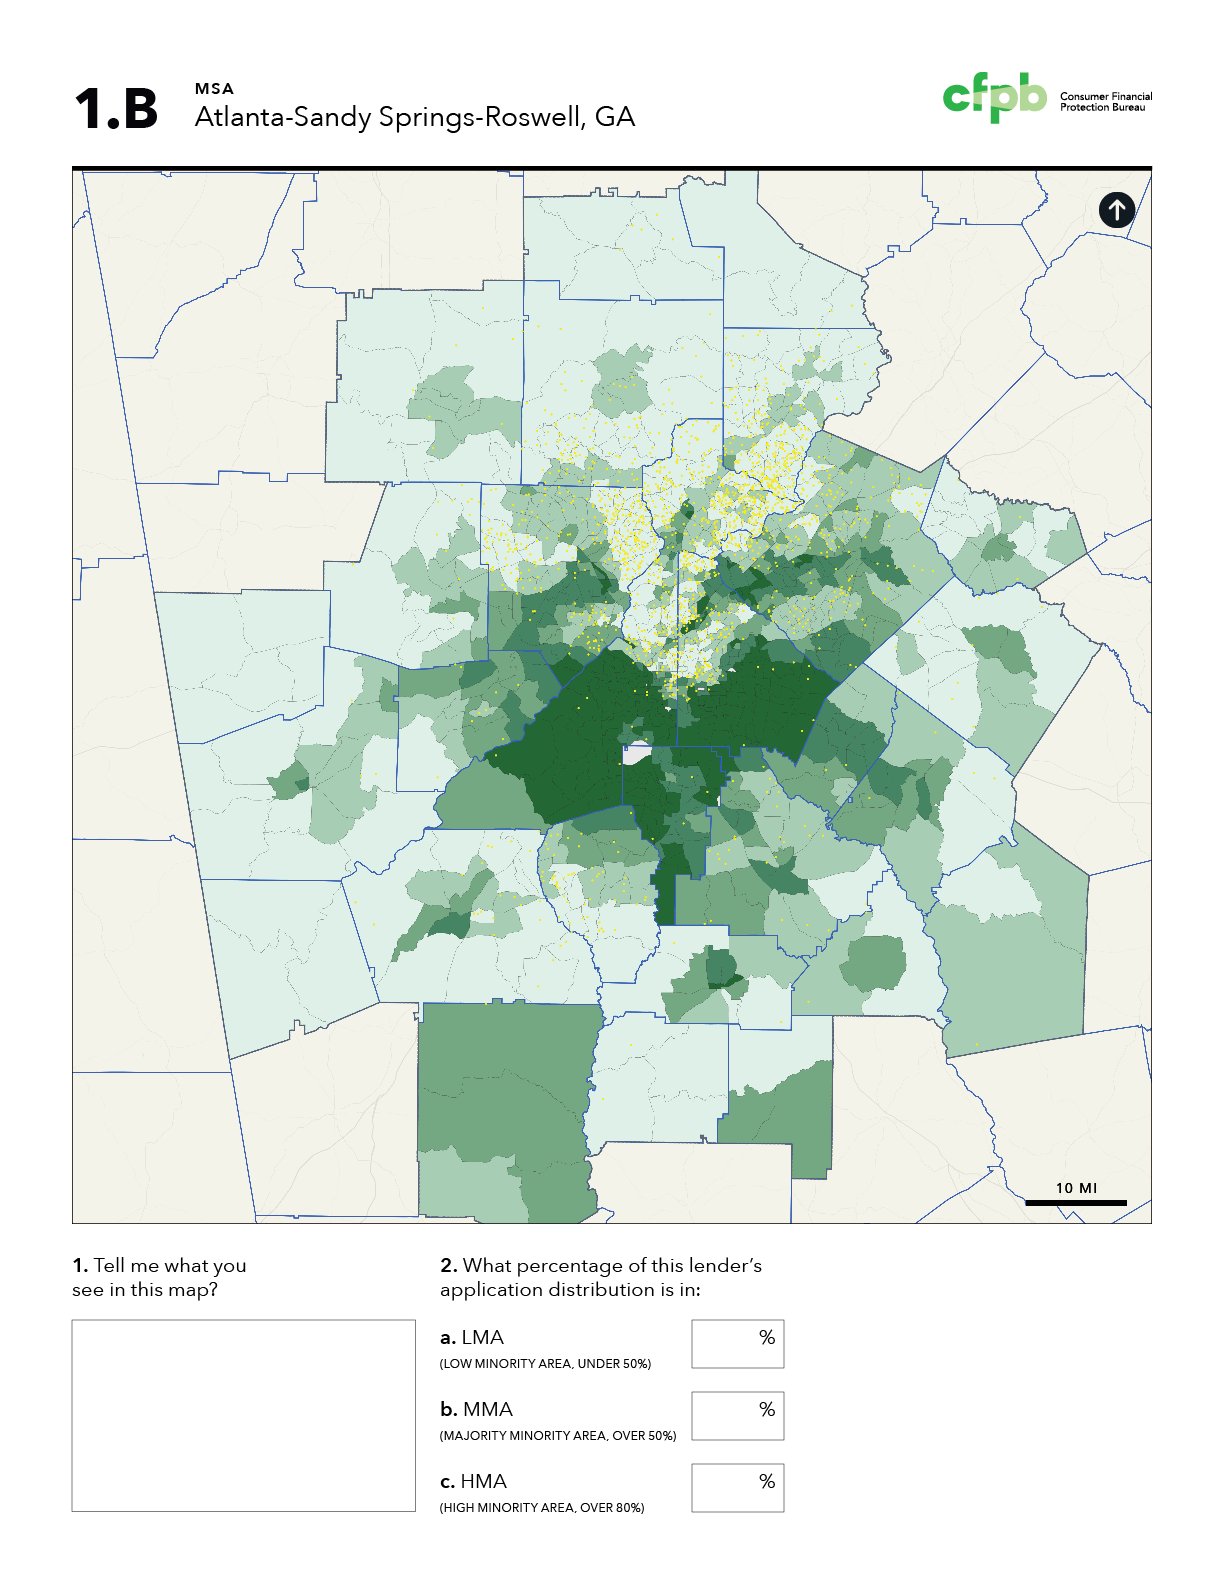
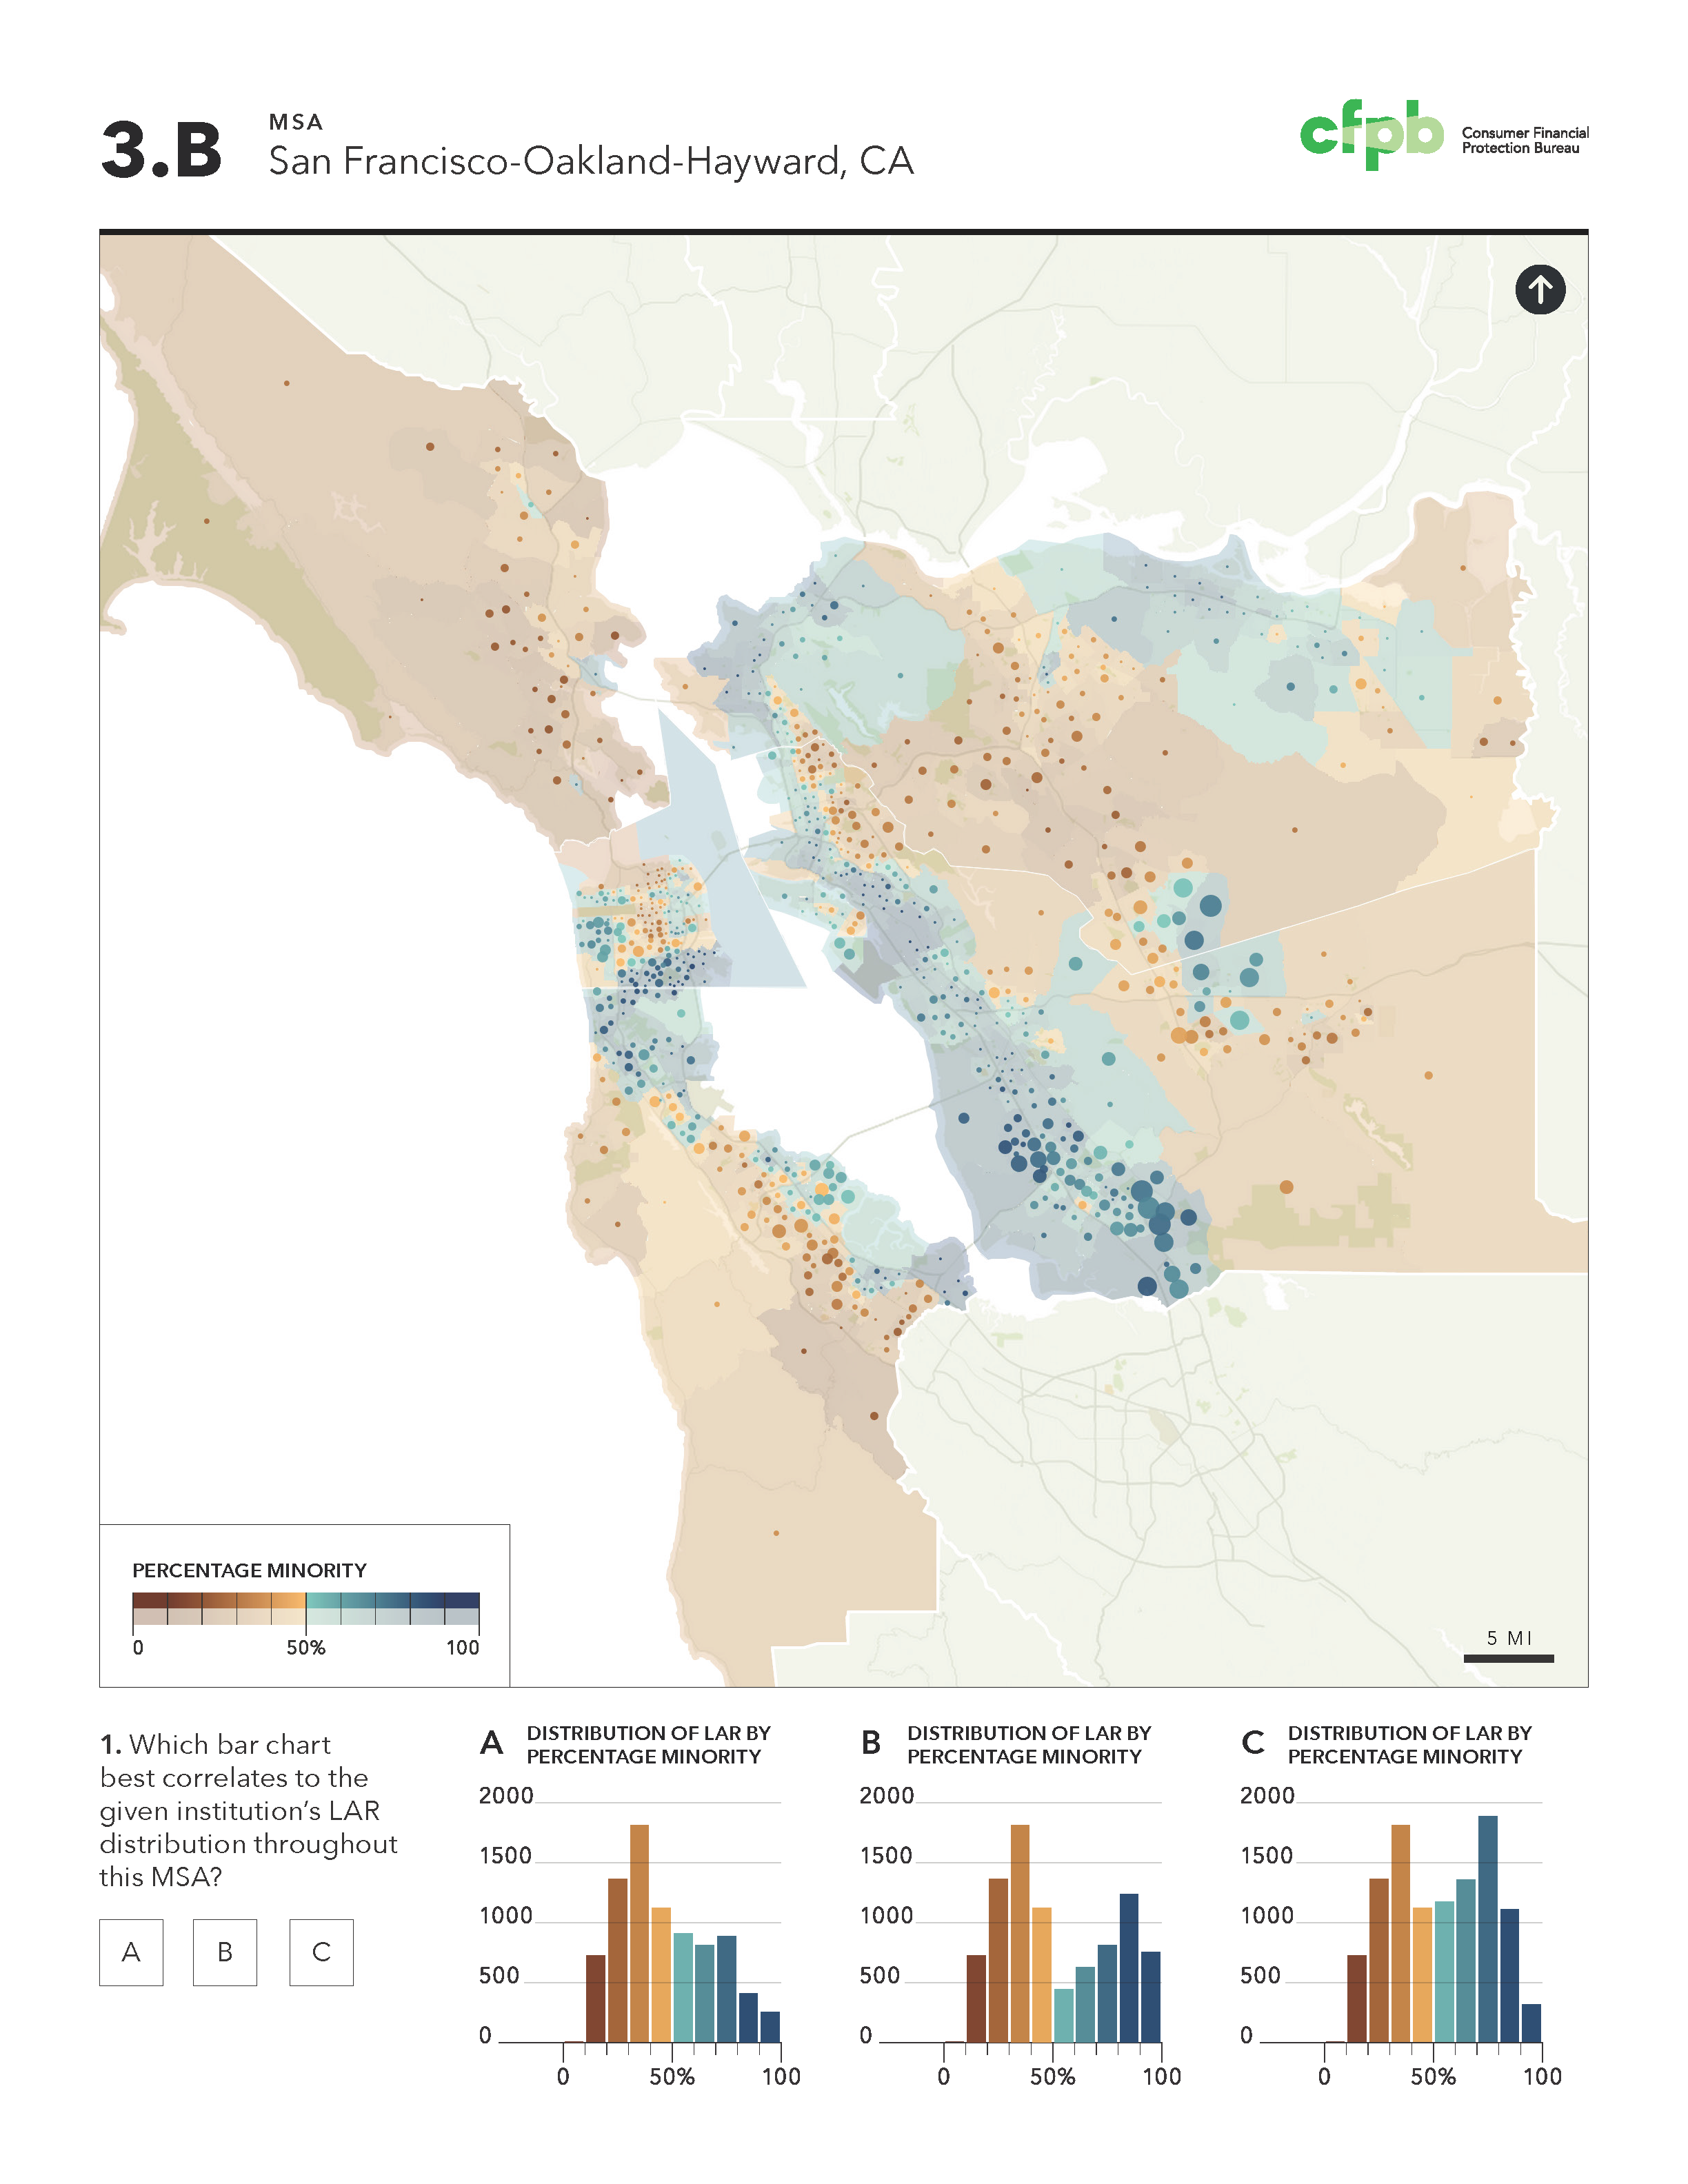
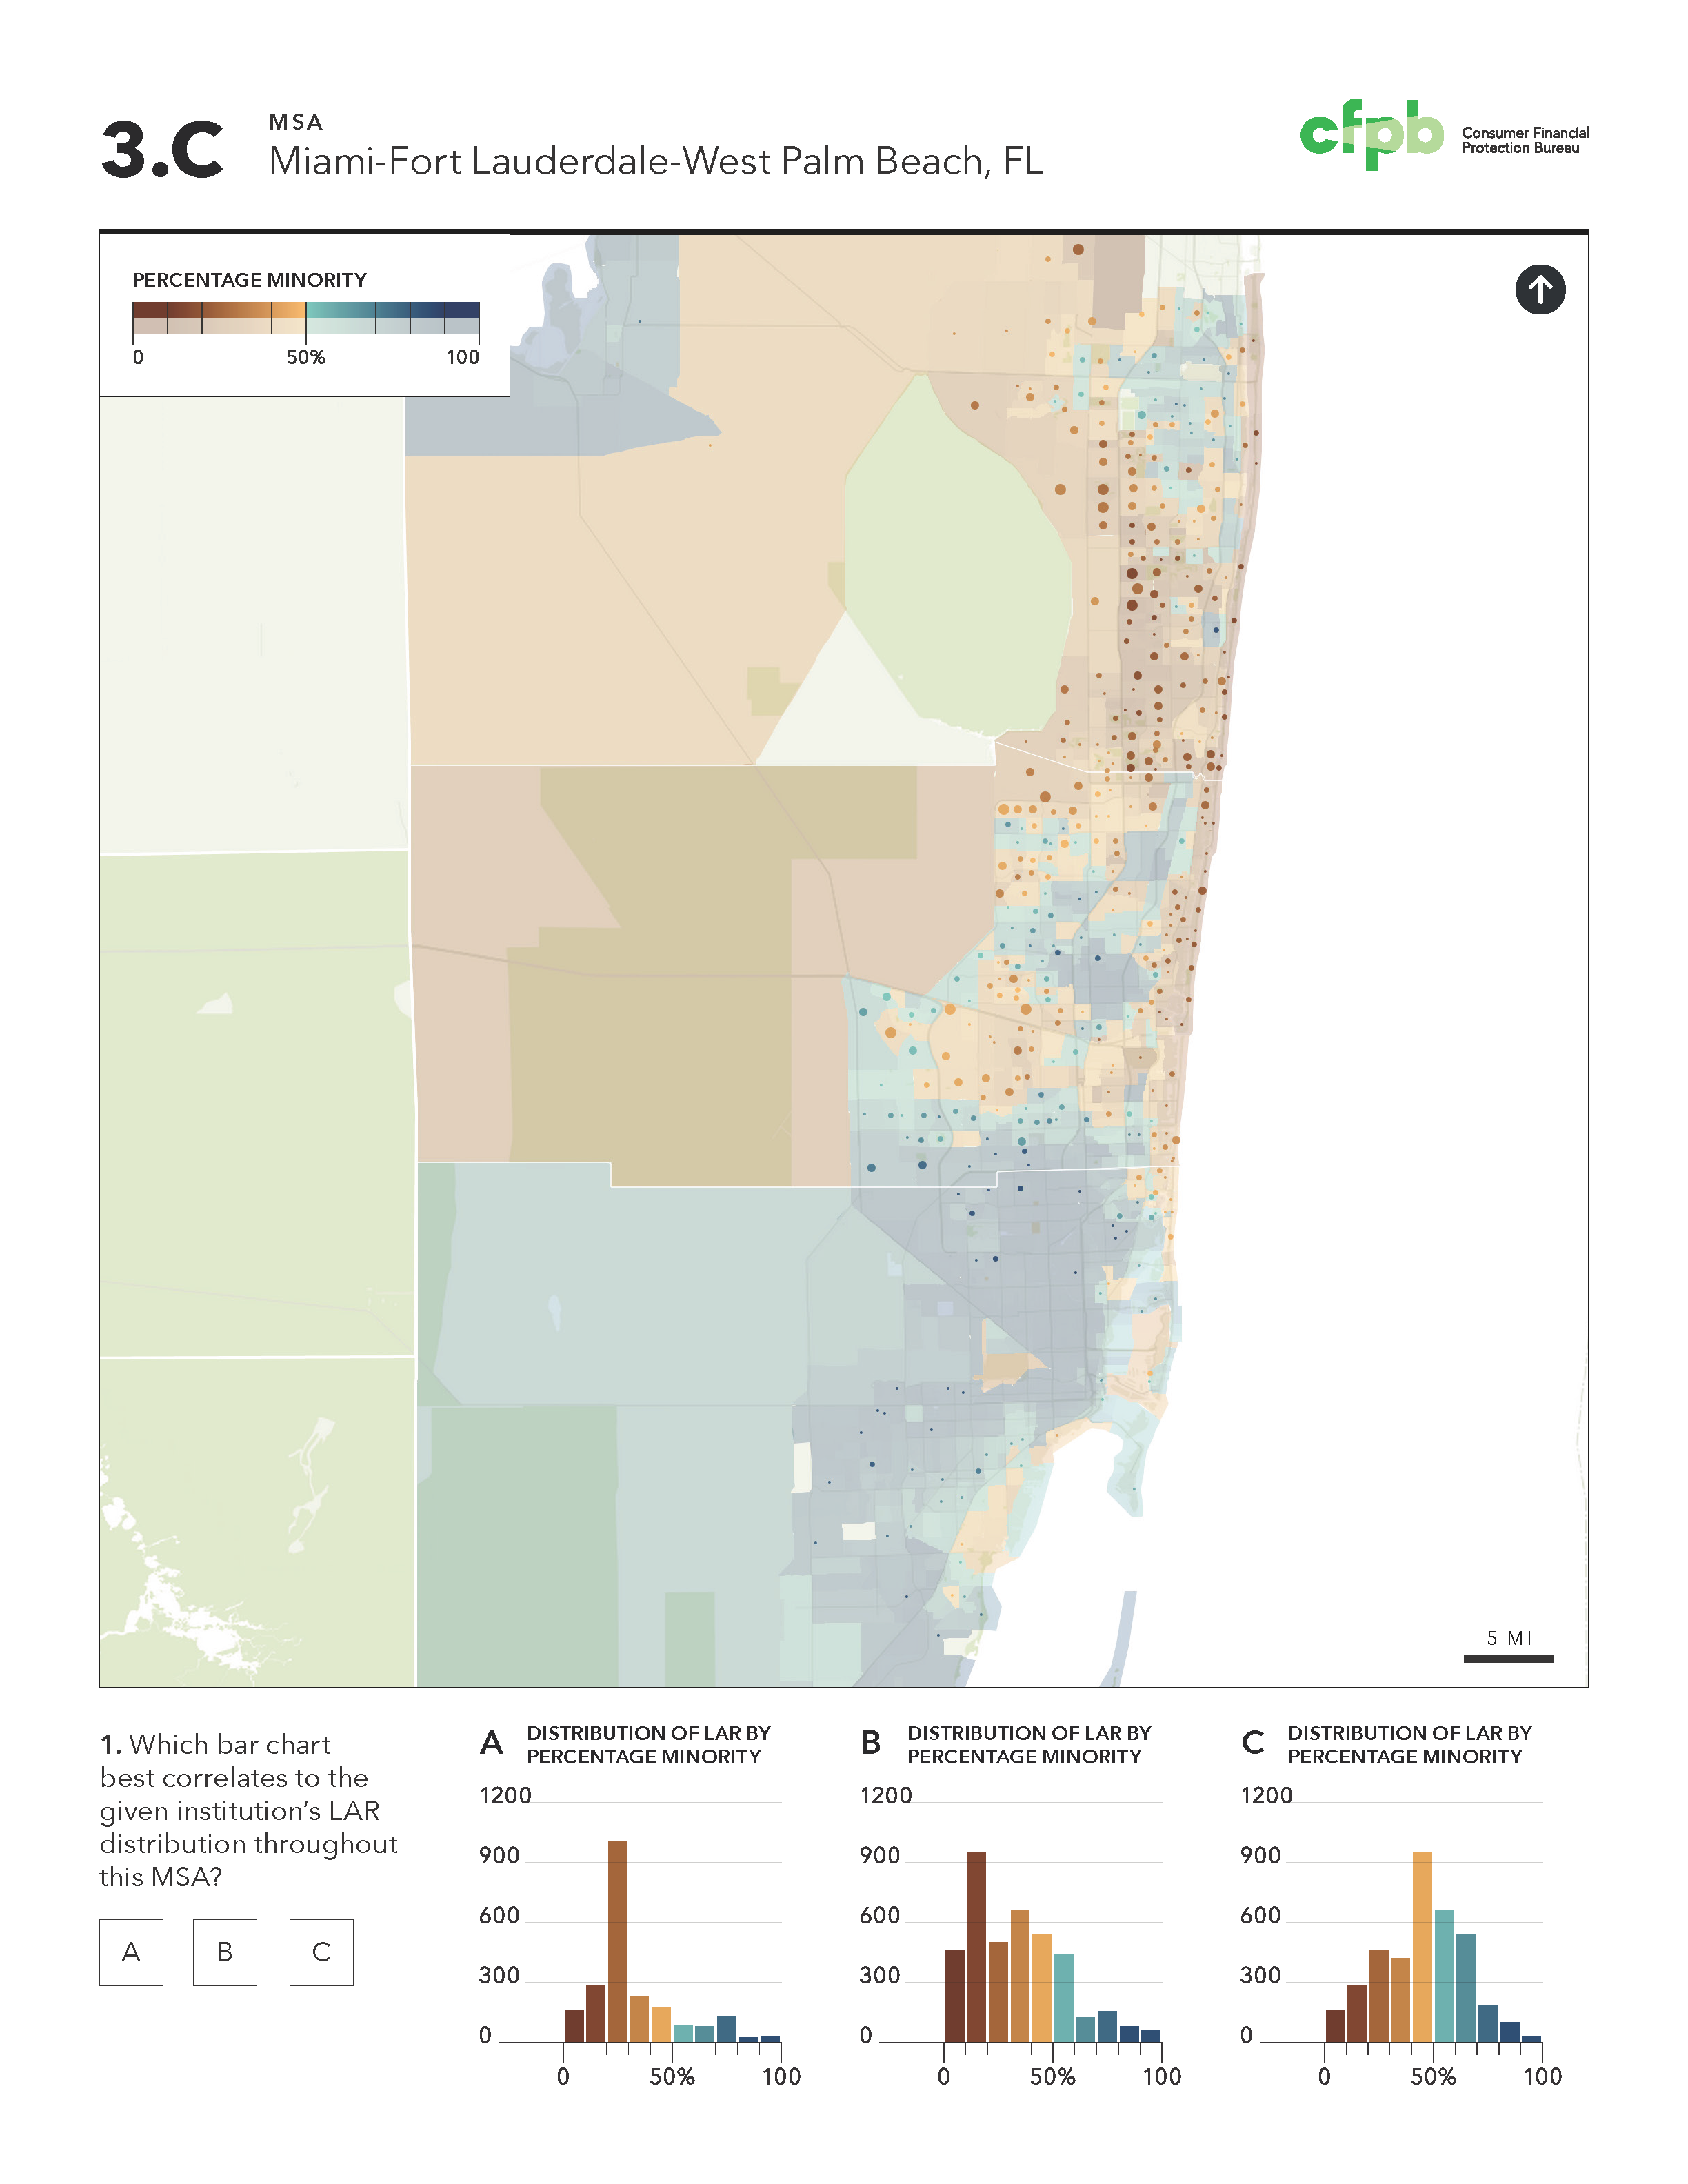
Exhibit 1.B below reflected the current visualization approach of the Fair Lending analysts. Options 1.A, 1.C, and 1.D below explore higher contrast color ramp alternatives, as well as tested the effectivenss of dot density vs. scaled circle approaches to representing lending patterns.


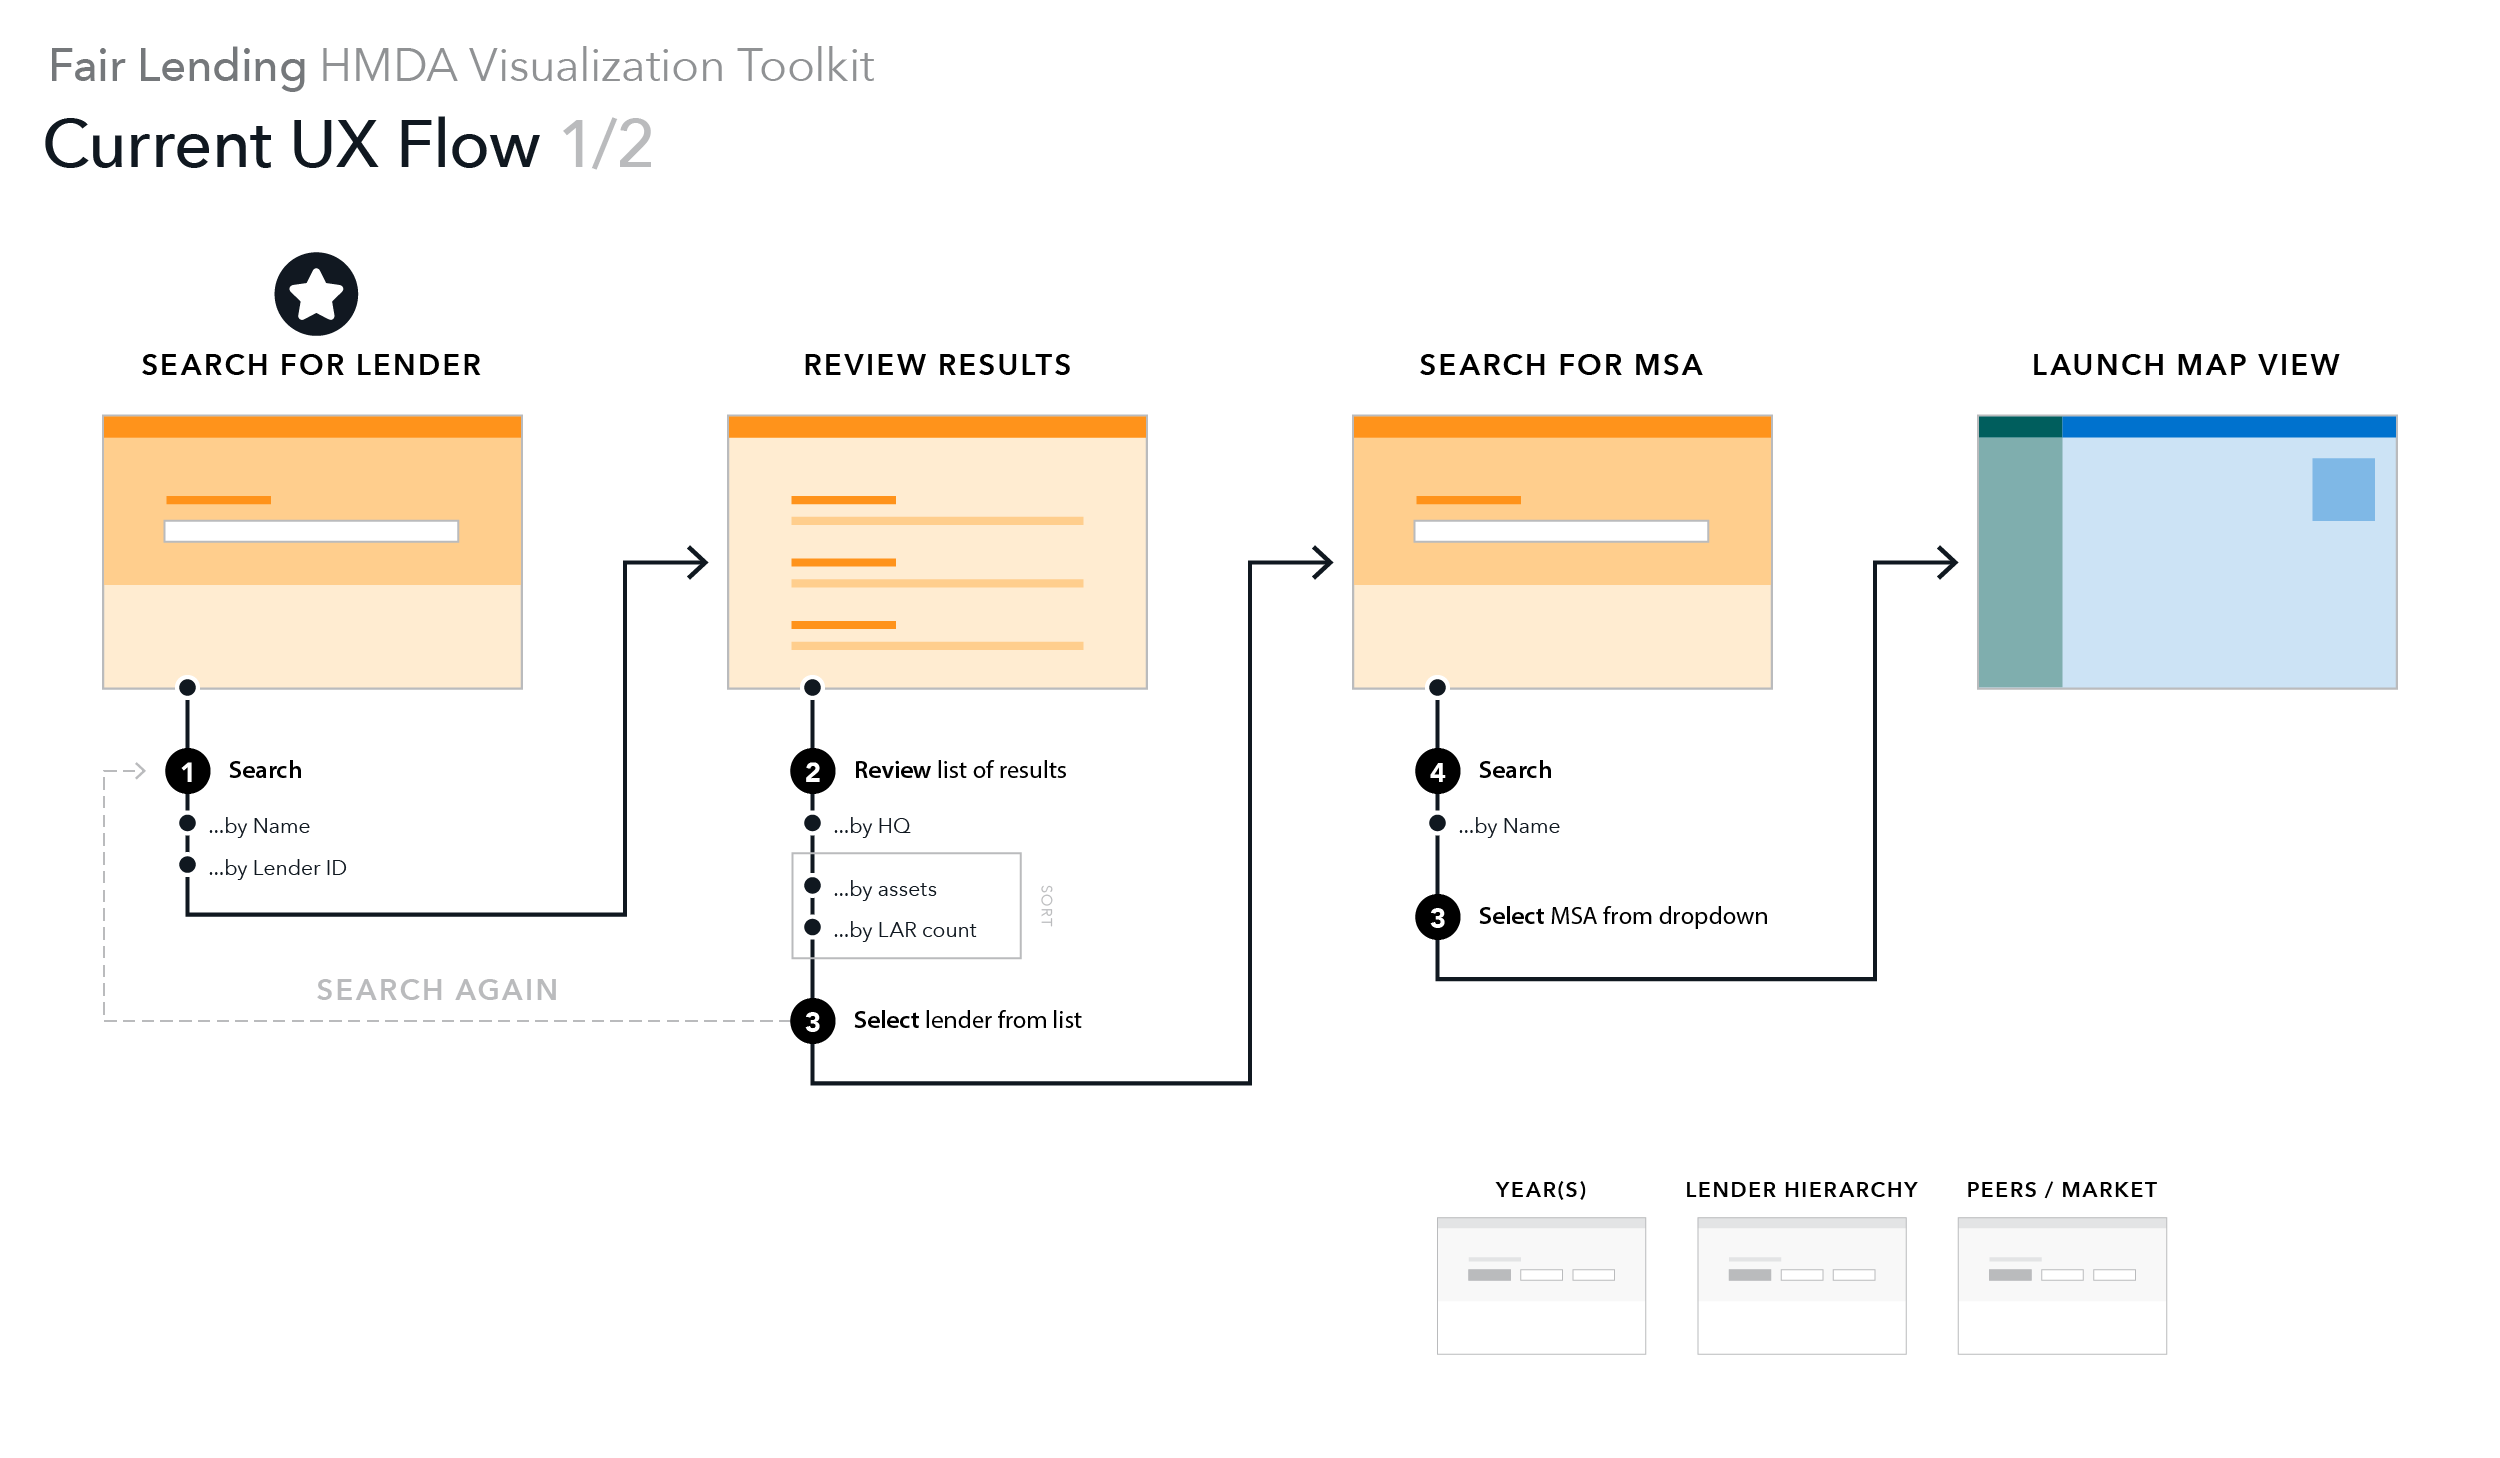
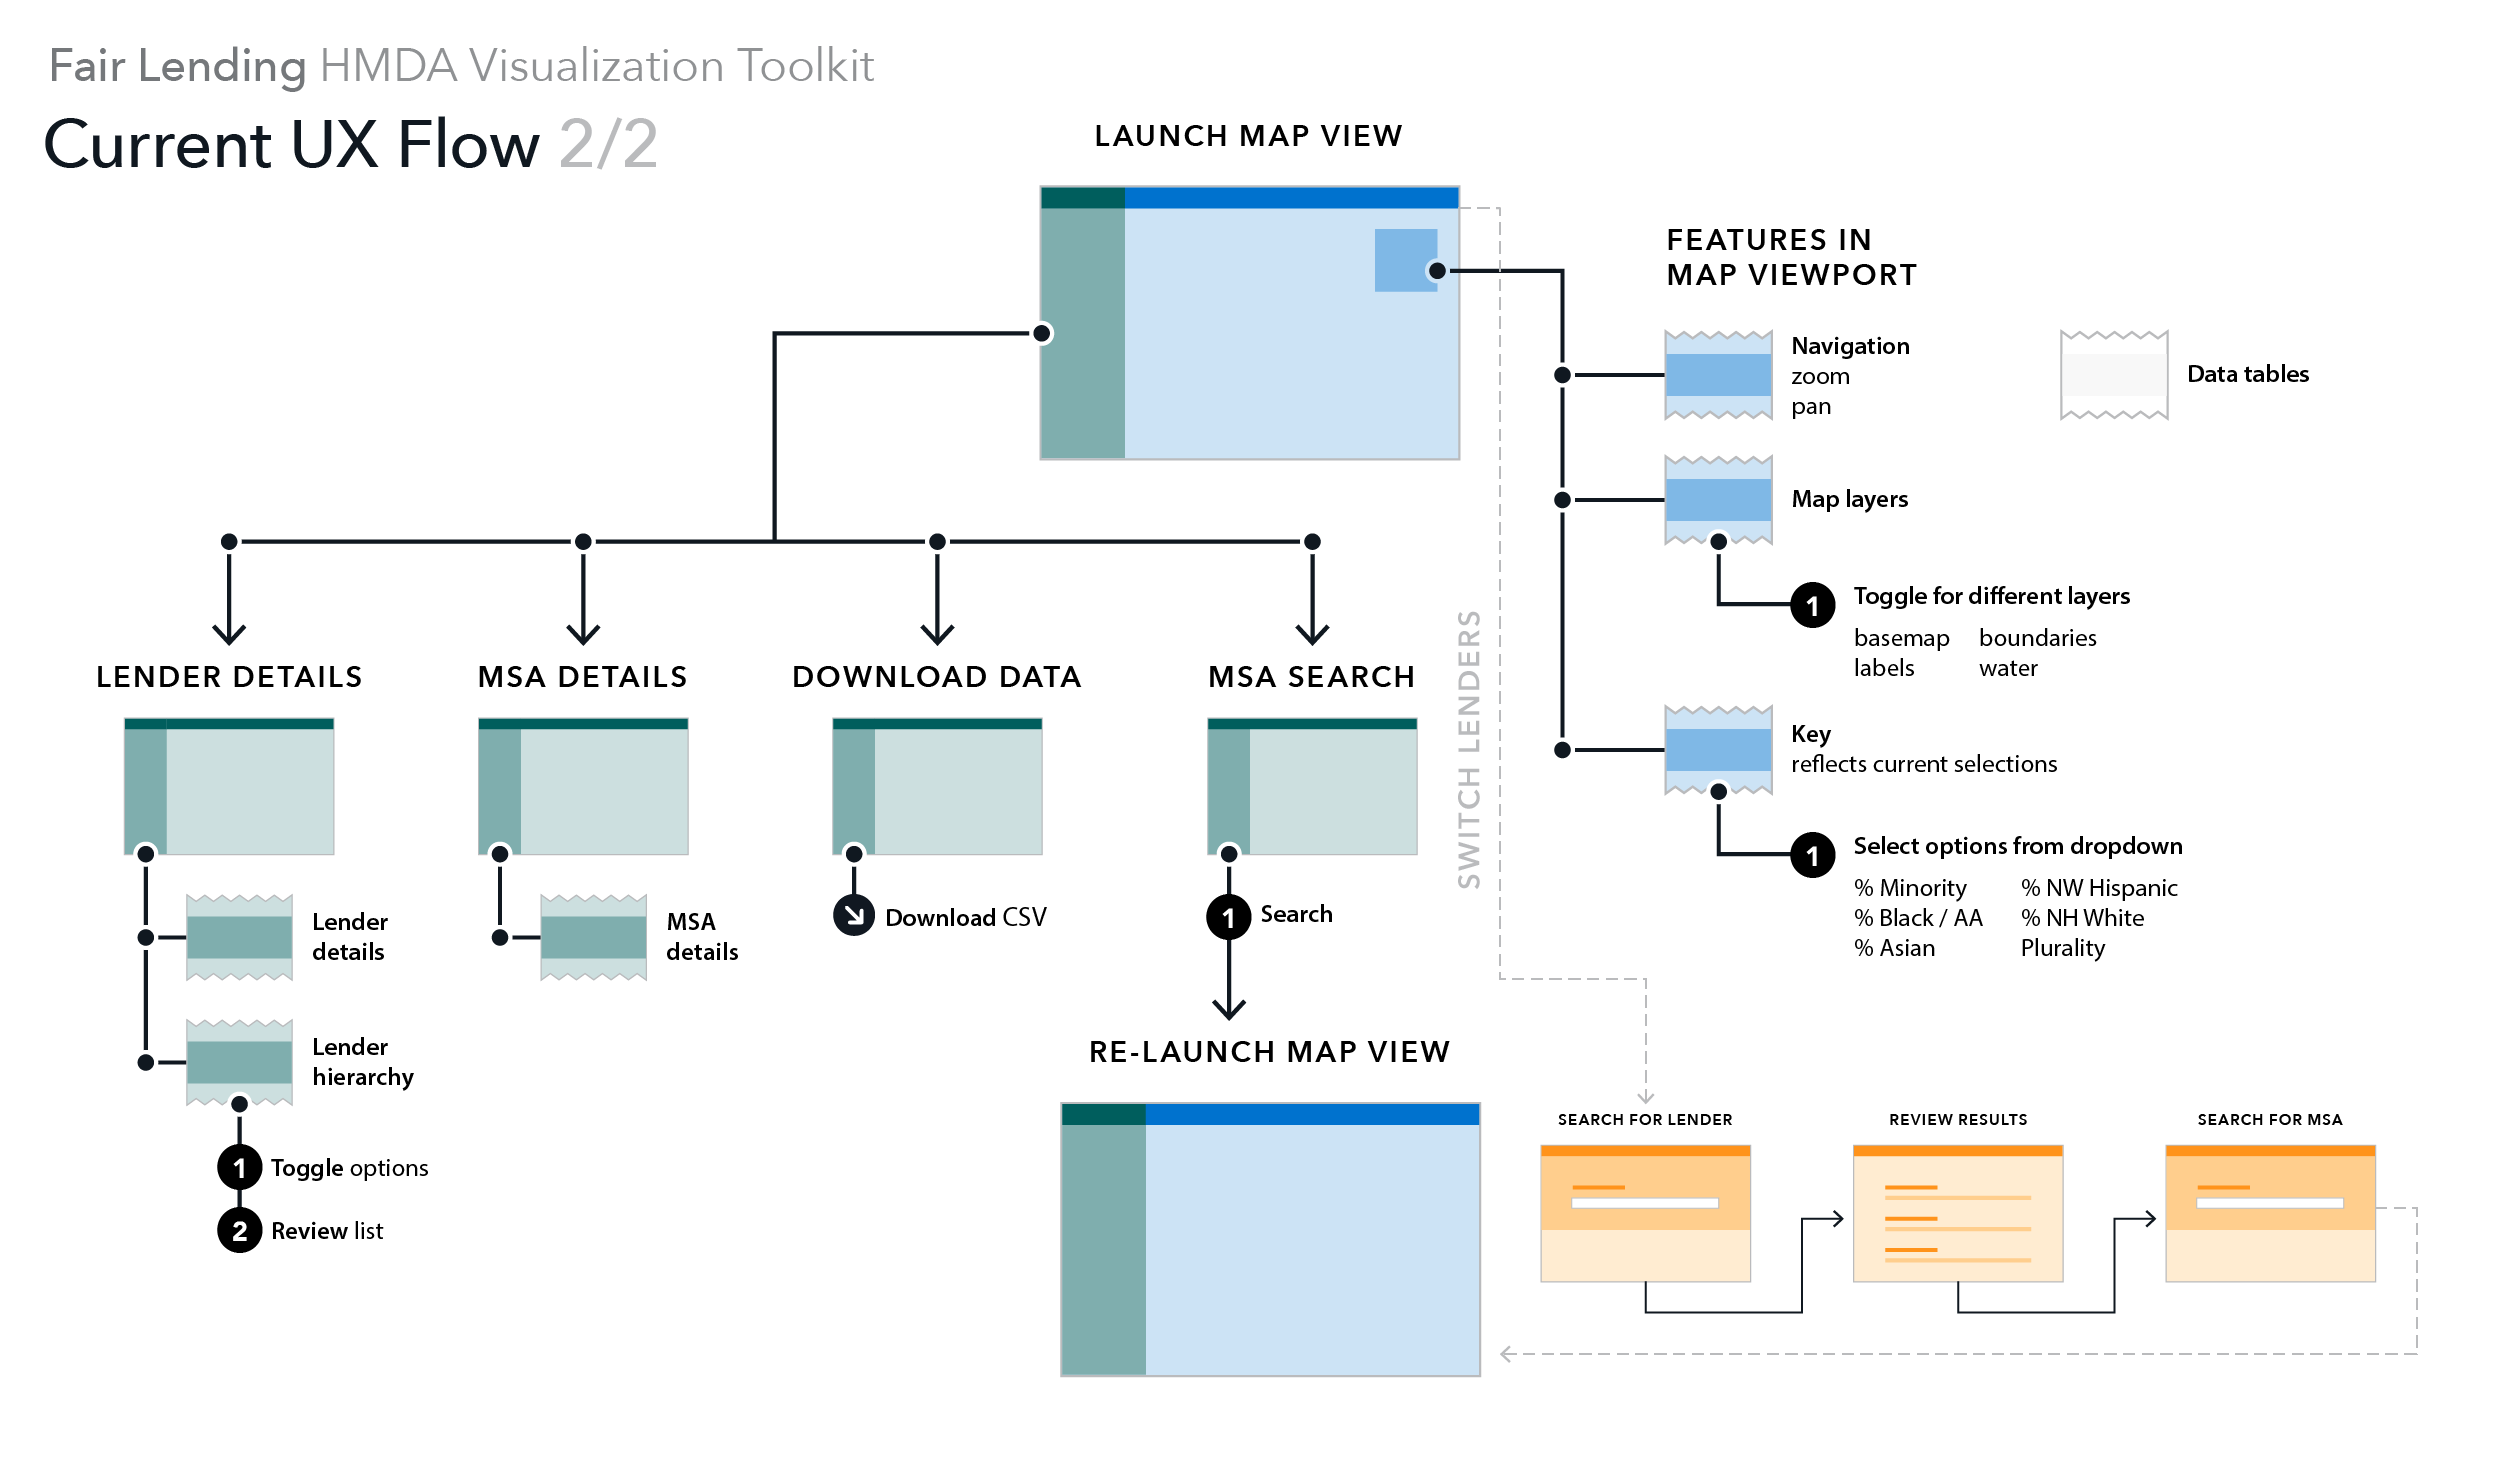
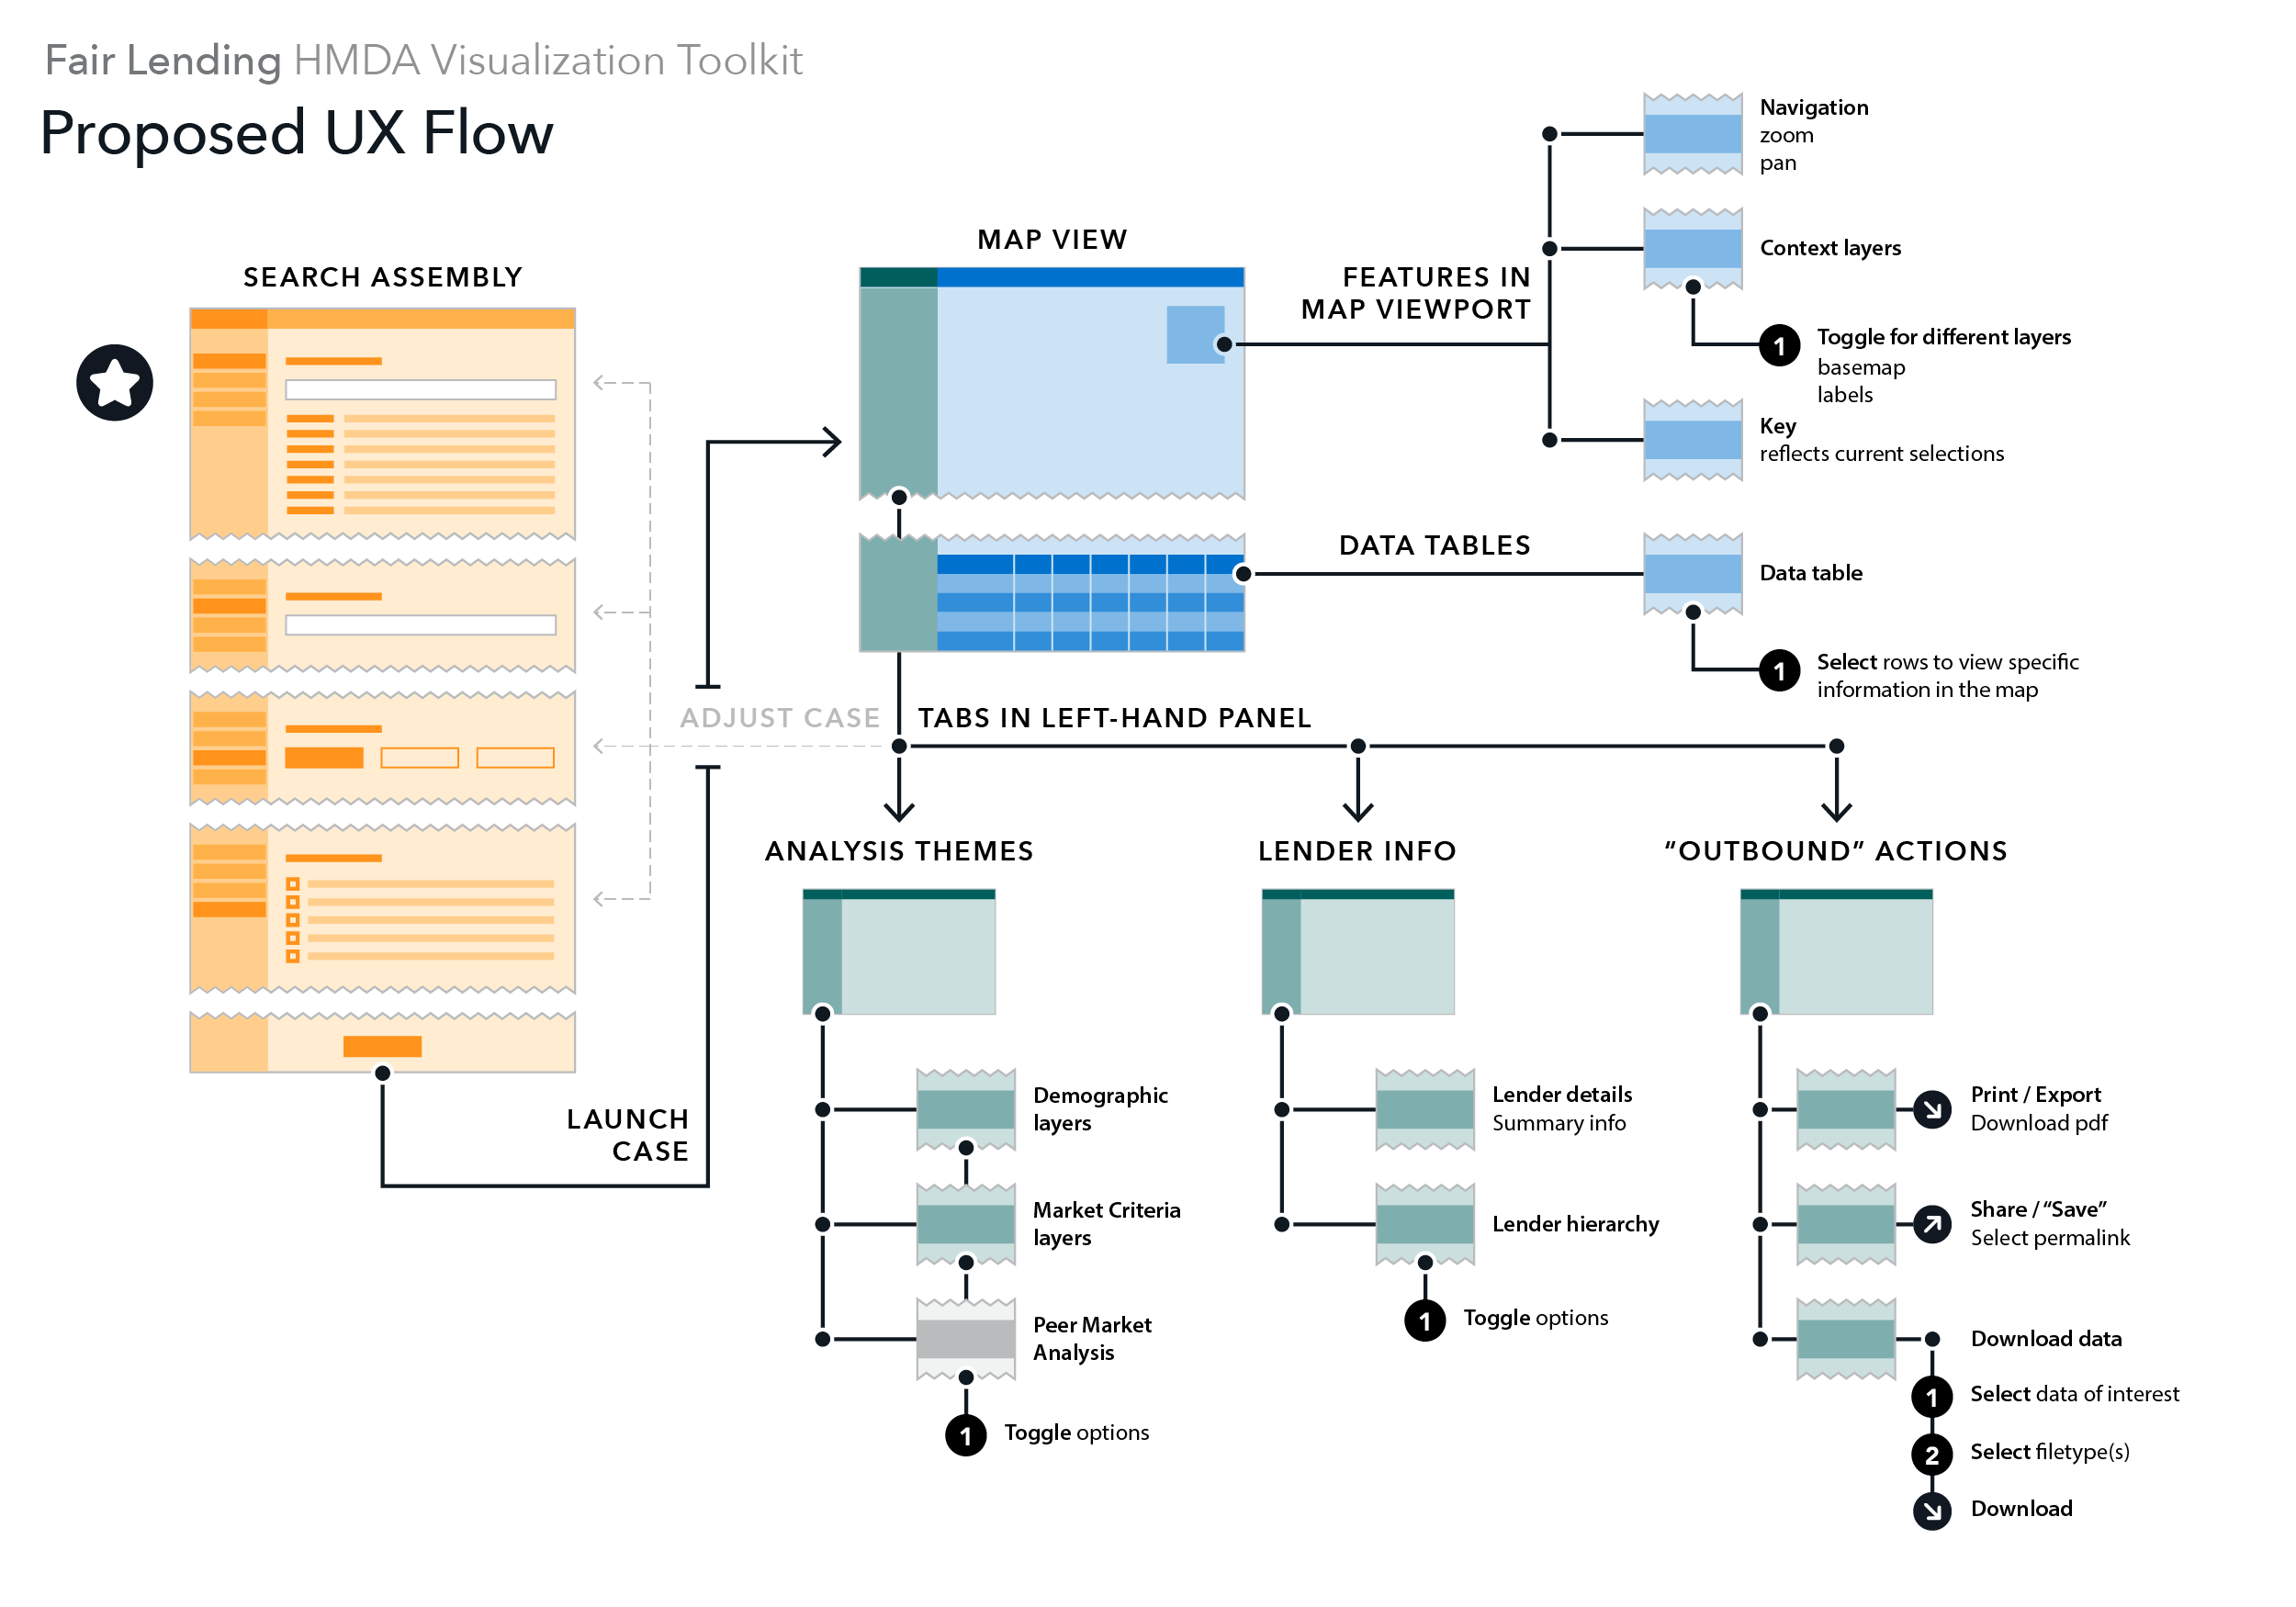
UX Flow
Stepping through multiple-pages before launching the tool.
The early-state experience flow had users jumping through multiple pages before launching the tool. In order to update the conditions of your case (which lender or MSA you're working in), you had to go through the entire multi-page flow again and relaunch teh tool.
Assembling your case
Experience flow updates proposed an upfront process of assembling your case on a single page, with the opportunity to modify your assembly at any point in your process.
Application Design
As the project's lead product designer, I established the application's structural interactions and UI visual design standards.
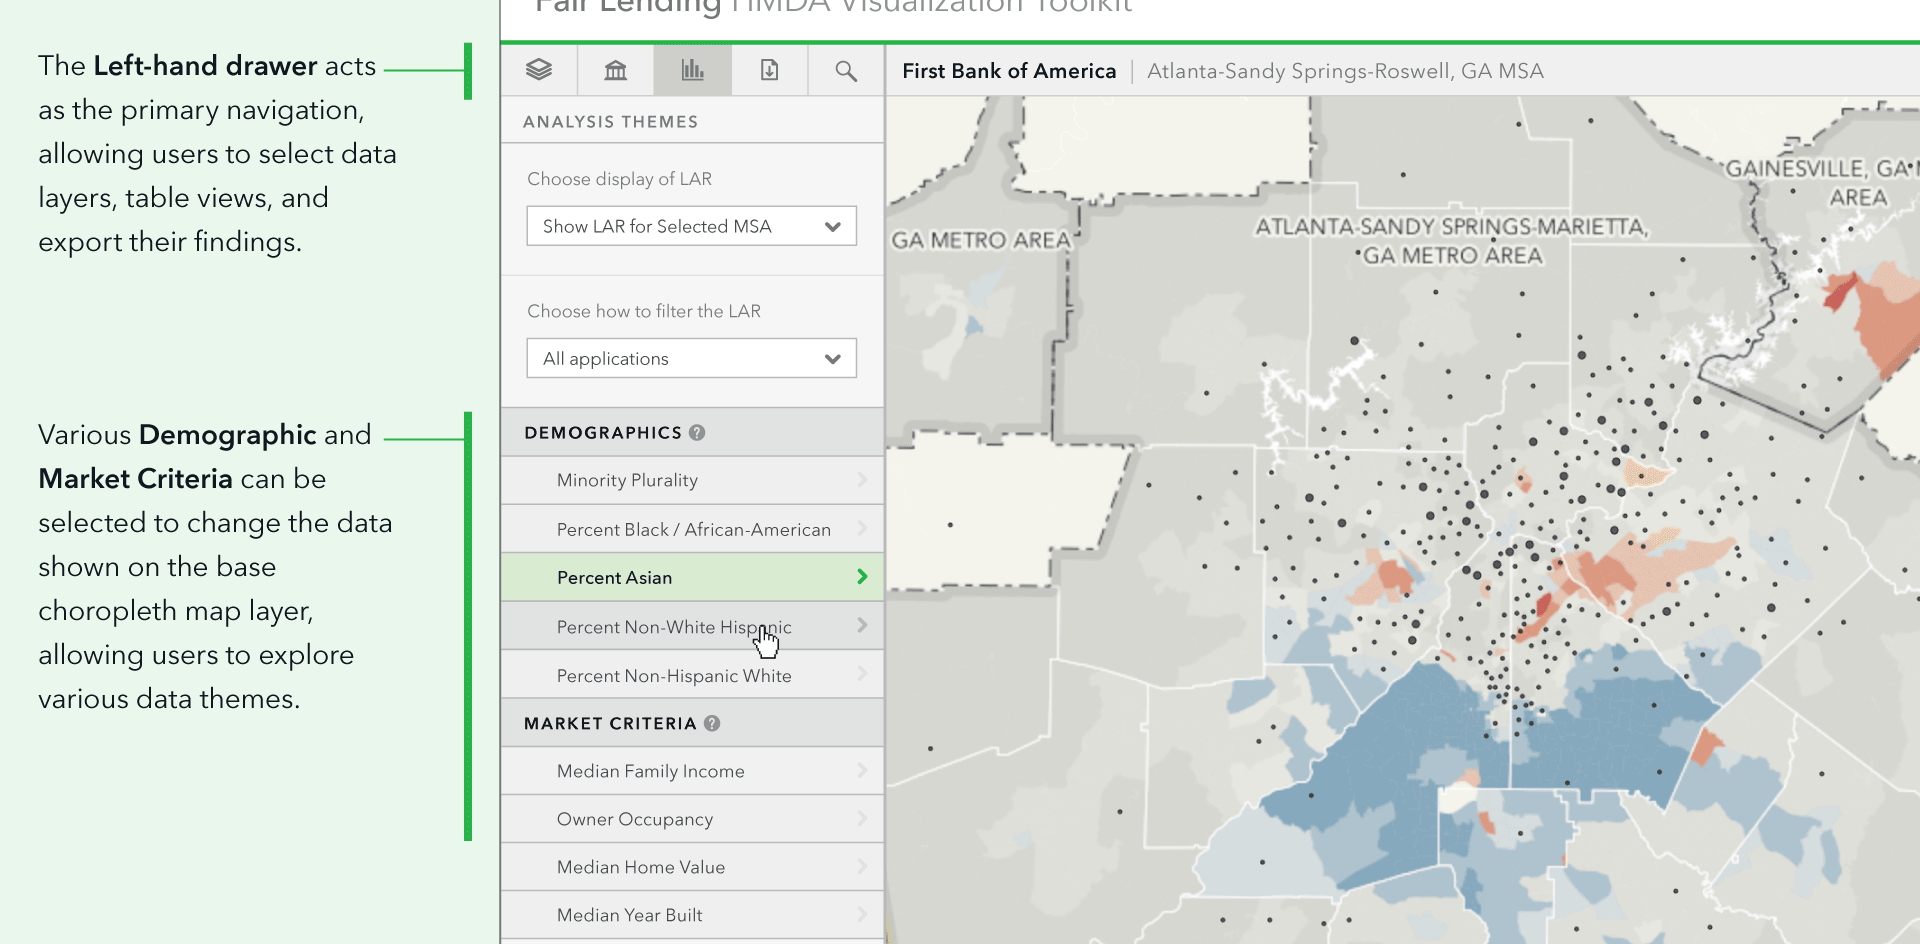
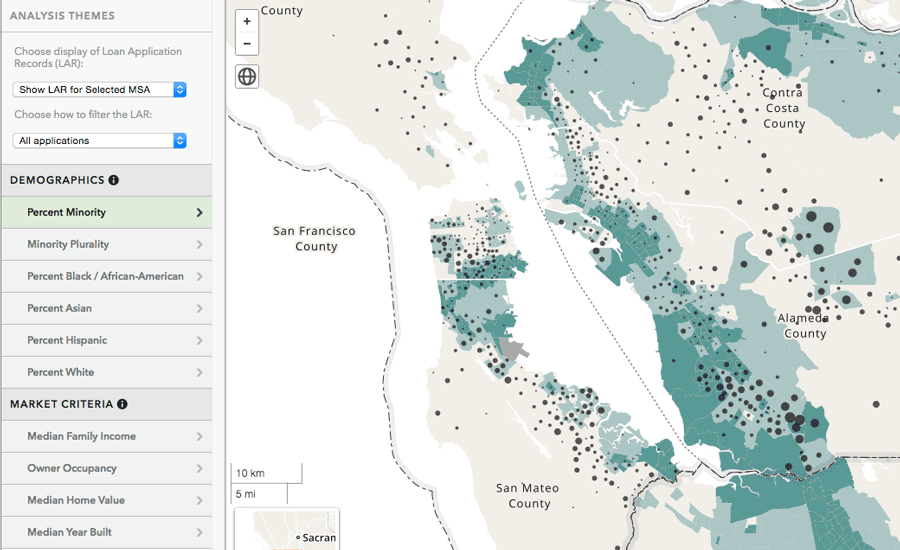
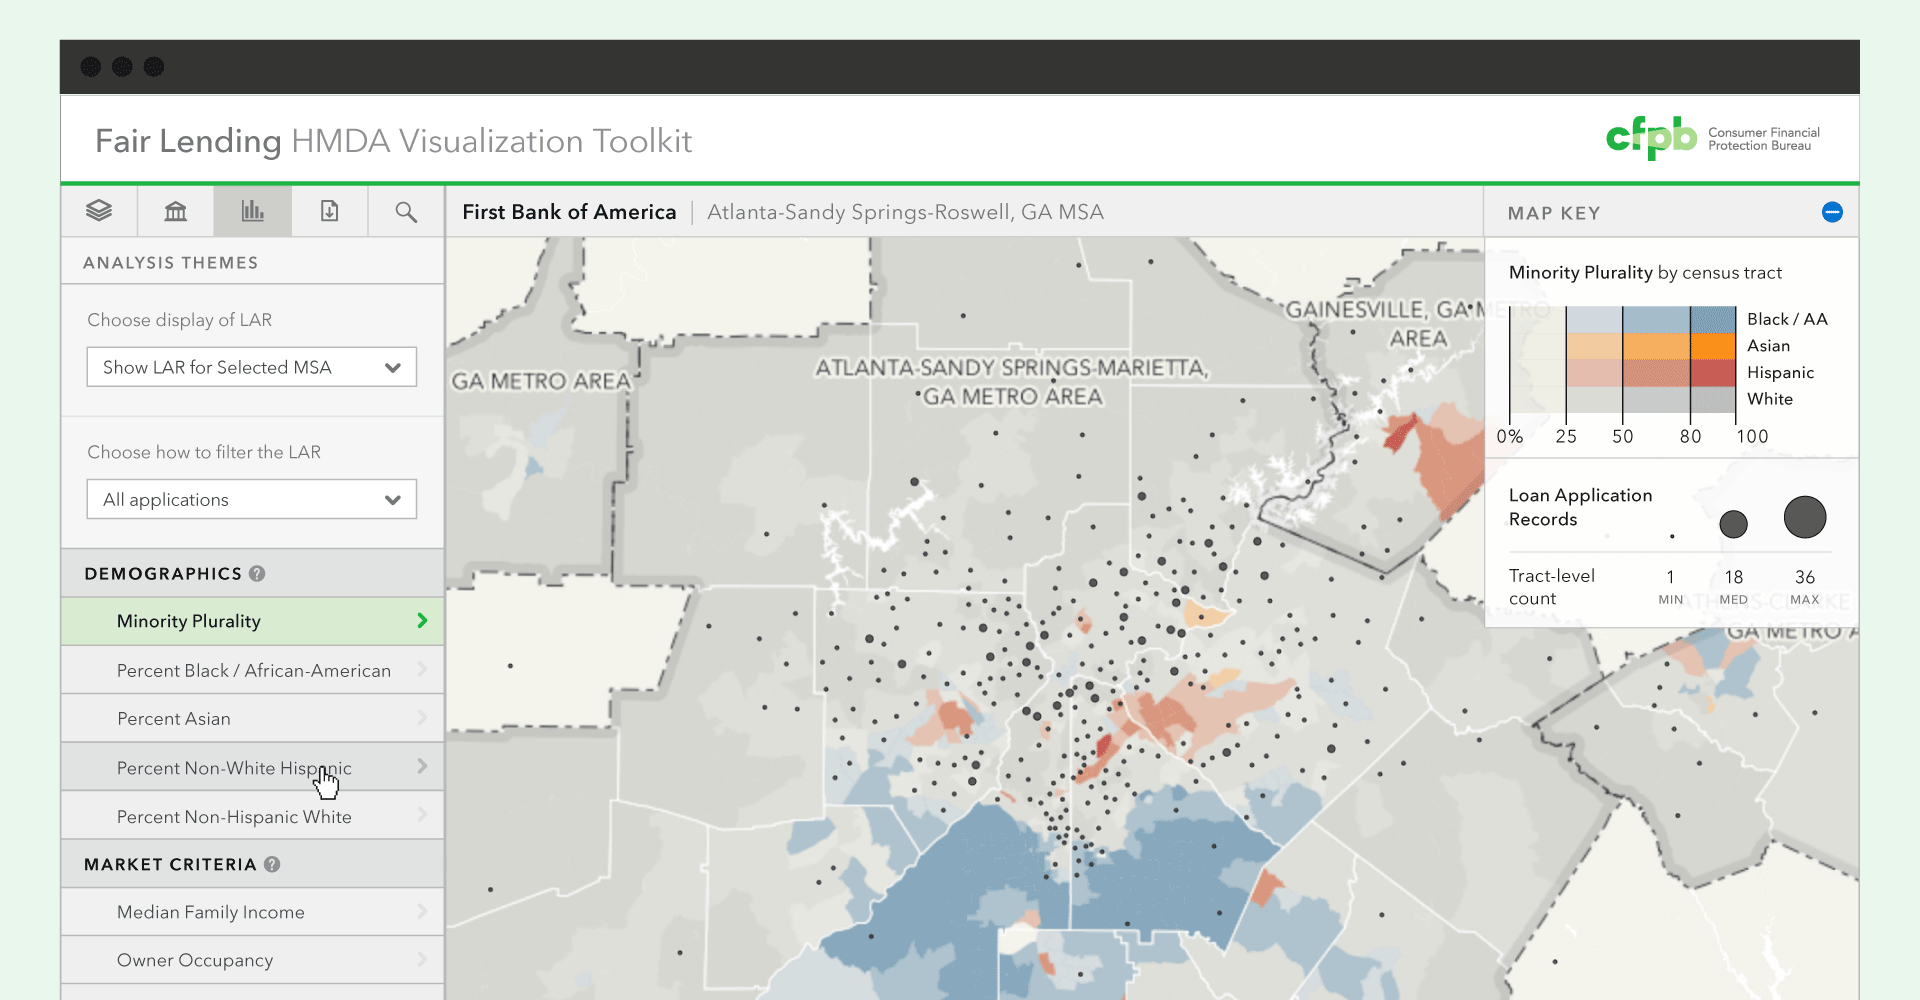
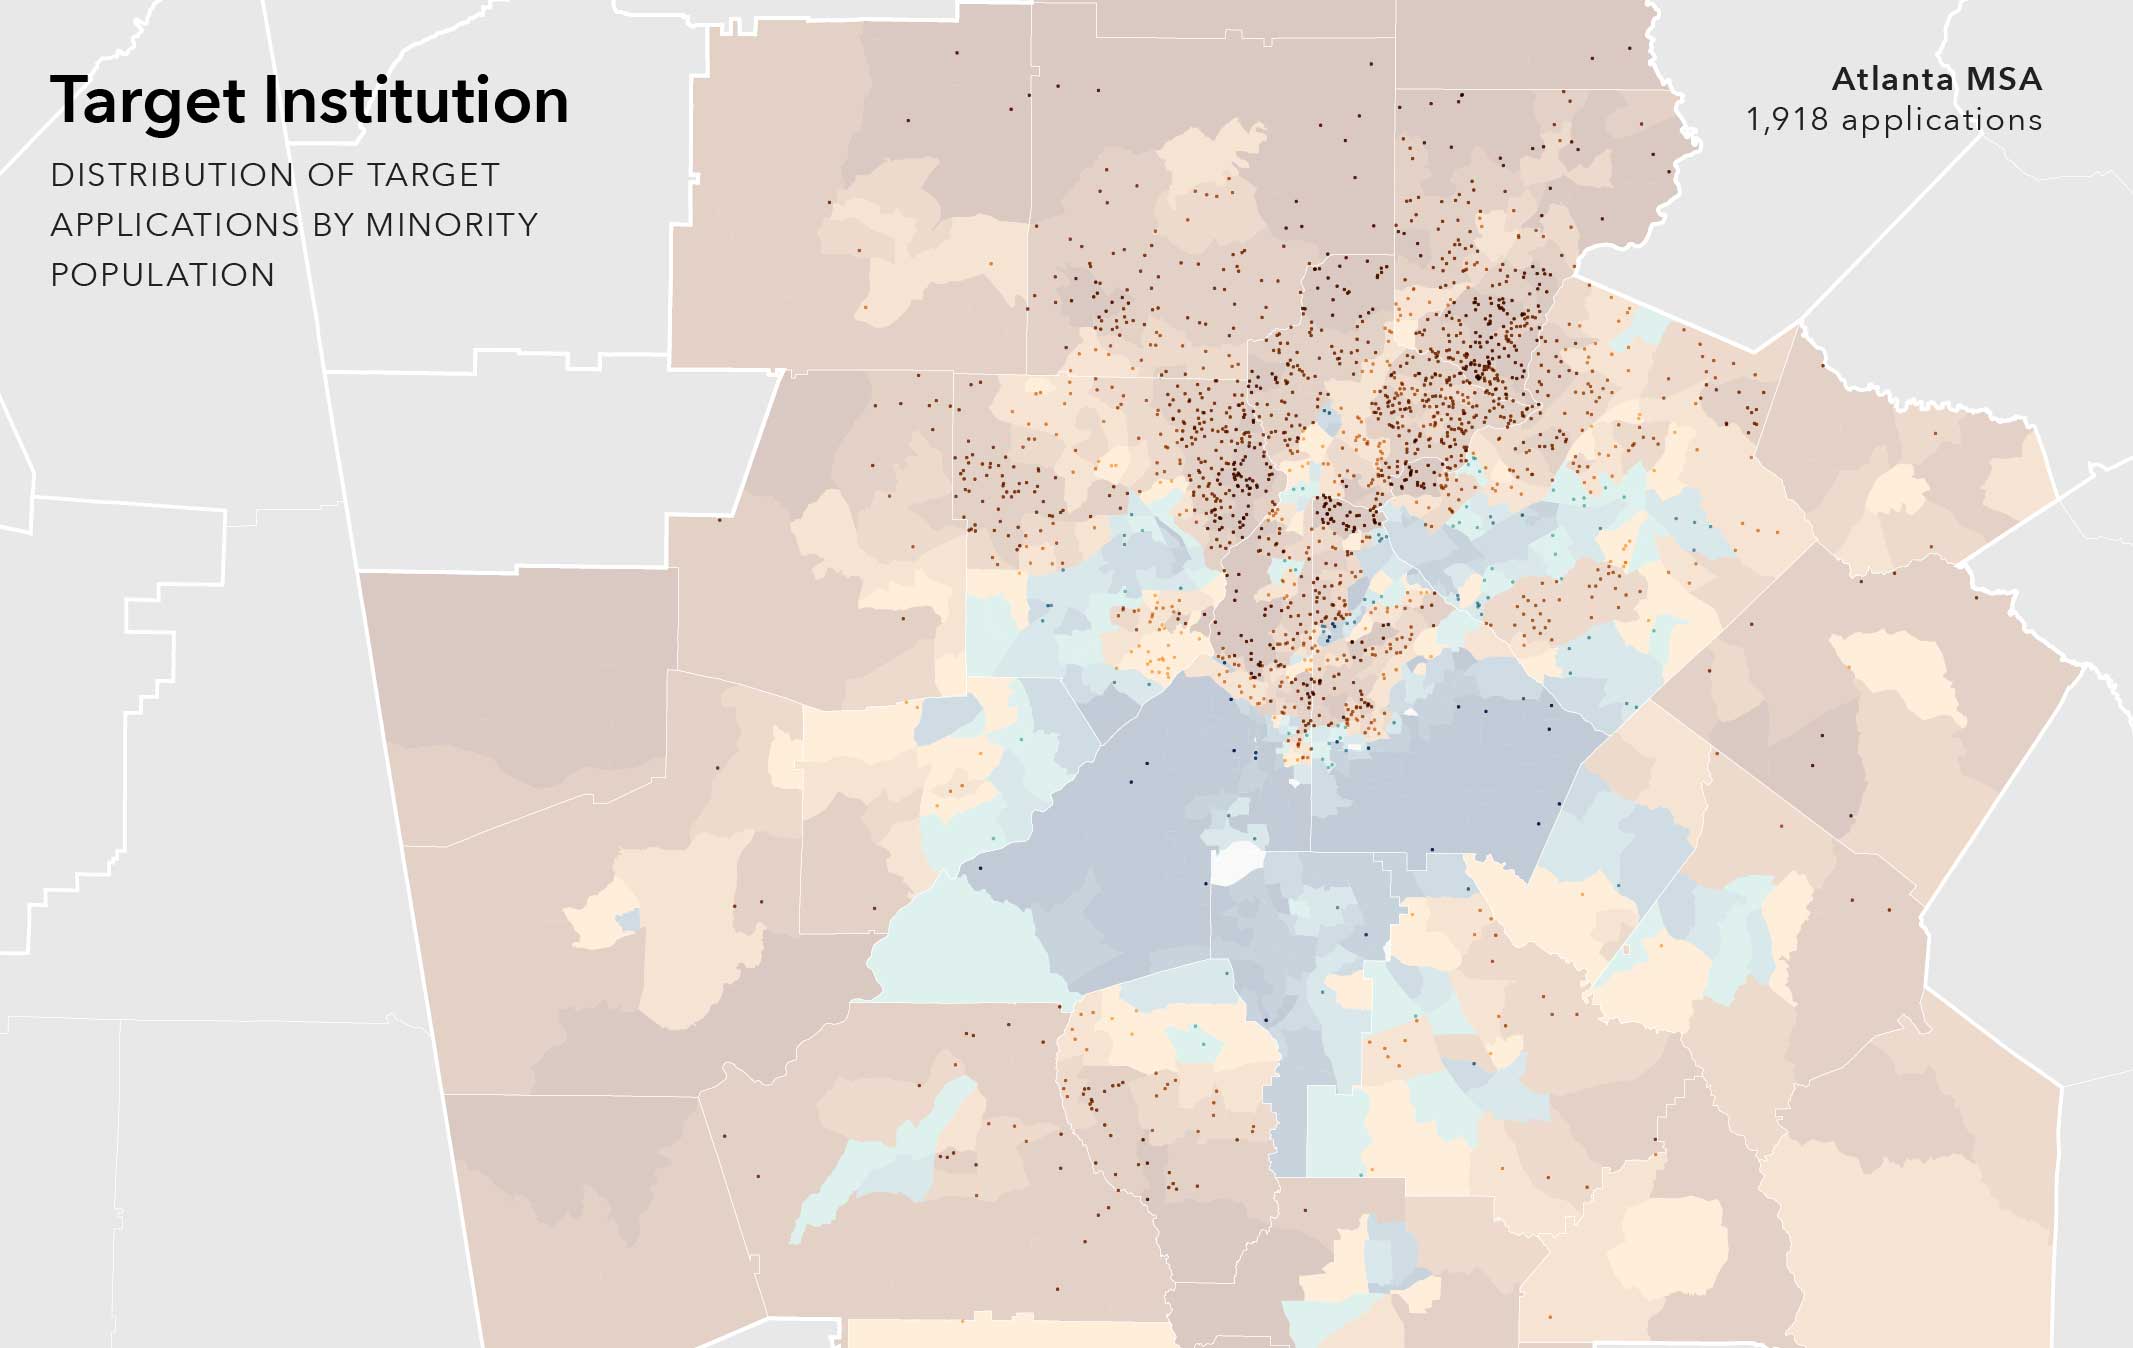
Demographic Layers
Color is used to display the racial/ethnic composition of different urban areas. Minority plurality highlights the dominant racial/ethnic group at tract-level. Color designates the predominant group, while saturation indicates higher percentage shares of the total population.
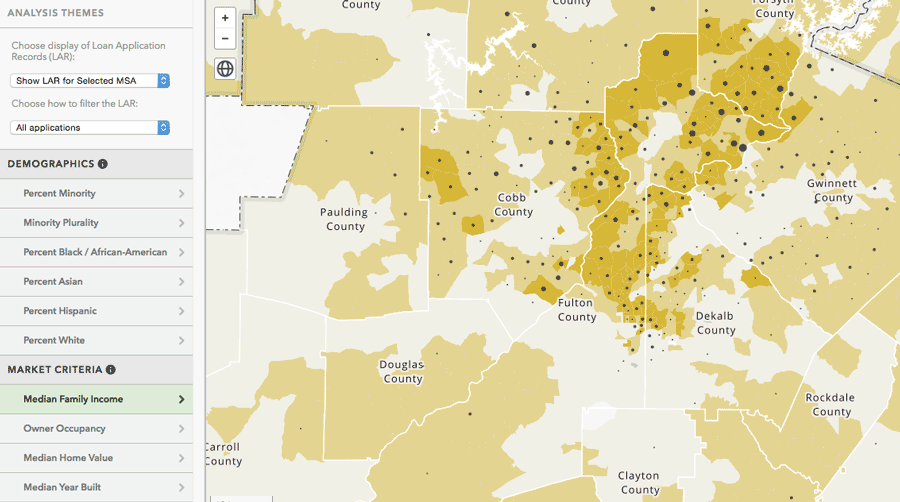
Market Criteria Layers
These layers highlight the financial and structural composition of the housing market, such as median income levels, the age and value of housing stock, and occupancy rates. This information helps highlights where housing market growth and lending are likely to occur.